Vision - Risk
Monday 28 April 2025
Risk is a powerful reporting tool pulling together results from events that effect
- Employees
- Assets
- And the Organisation as a whole
It is completely configurable pulling in events from:
- Tachograph Analysis
- PCN (Penalty Charge Notices)
- Vehicle Inspection Services
- Training
- Licence Checking
- Collisions
- Operator Licencing
- And multiple integrations including Samsara, DVLA, Isotrak, GeoTab and TTC
When events are triggered, they are given a weighting. The numbers are calculated to give an overall risk score which is measured against a configurable banding to give you a clear picture of how your operation is performing across the 3 areas:
Setting up Risk
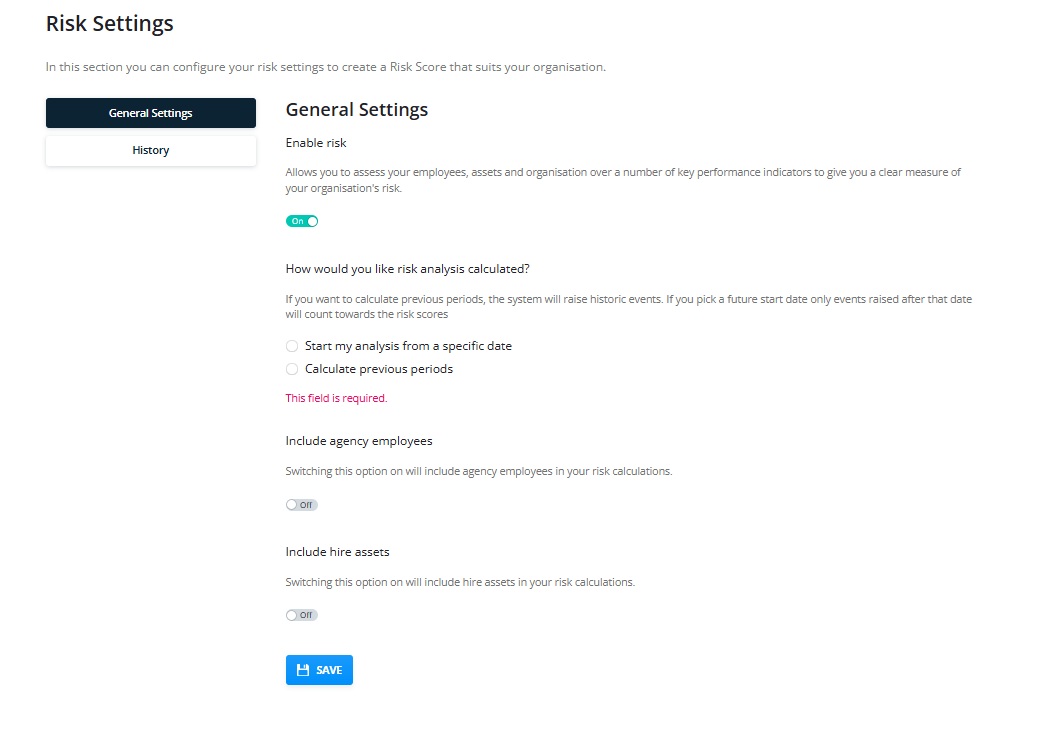
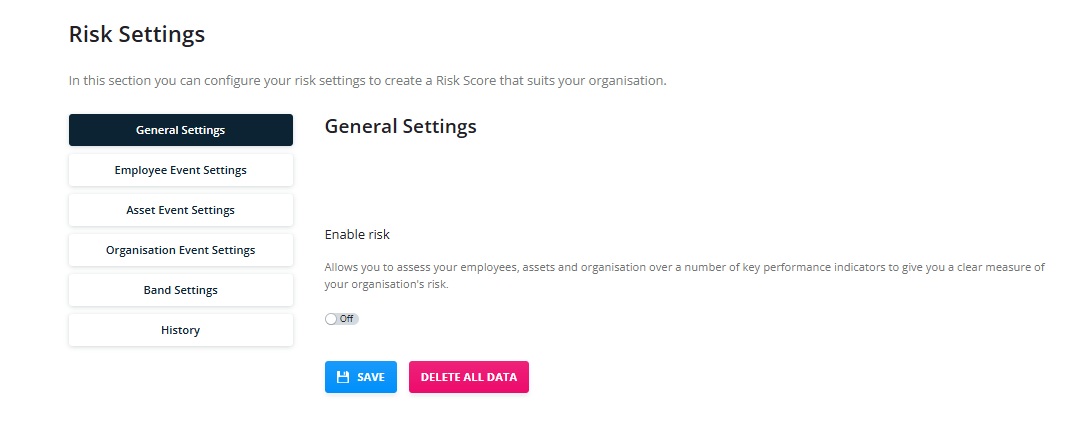
Once you have Risk enabled on your account, if you have the Primary contact or Company Admin Role you should head to the Risk Settings page:
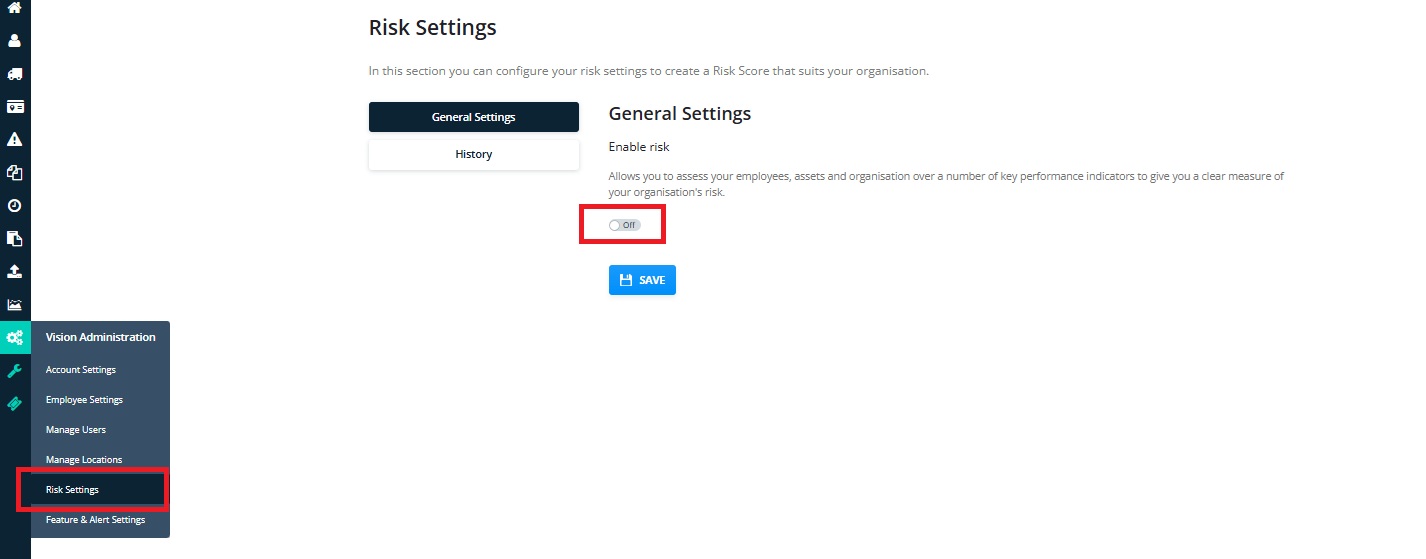
Switch “Enable Risk” to “on” to show the following options:
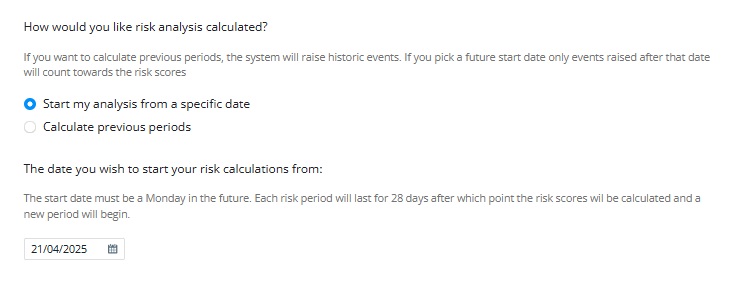
Risk calculates in 4-week fixed periods that will always start on a Monday and end on a Sunday.
You can choose to start your Risk analysis from a date in the future to allow you to put company procedures in place prior to using Risk:
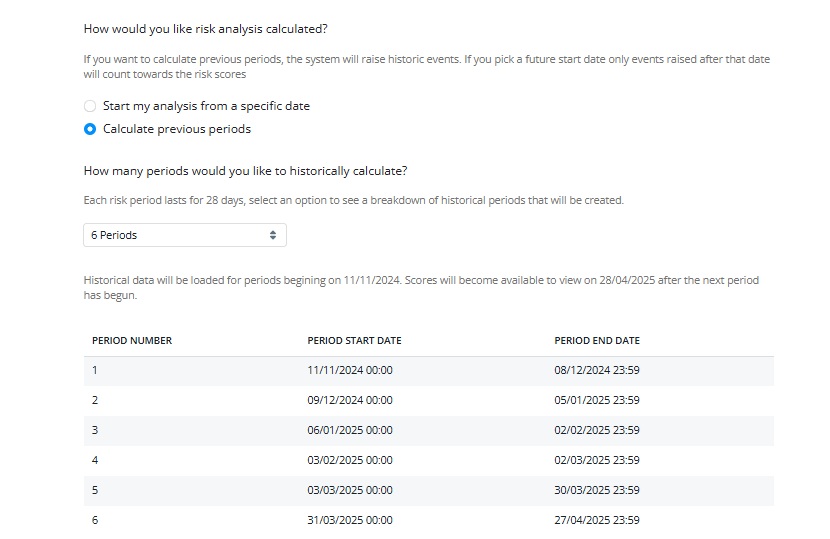
Or you can choose to show analysis going back up to 10 periods in the past so that you can see how the company is trending.
In this example we have chosen to go back 6 periods. In this example Period 6 is the “current” period:
You can then choose to include or exclude agency drivers and hire vehicles from your risk calculation:
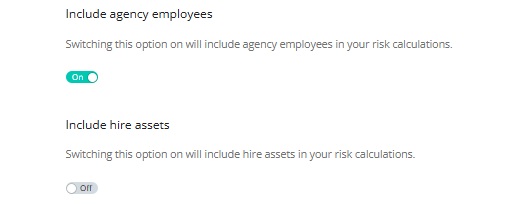
Once you have made your selections click “Save”. This will start the Risk calculation process based on the default settings.
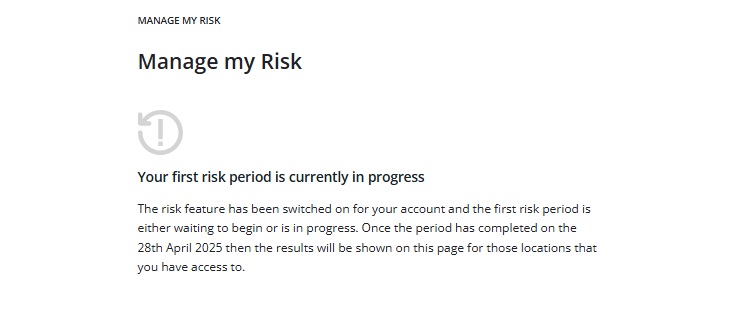
Results will not be available until the end of the first or the current period
In the example where the calculation begins on 21/04/2025, the first period would be available to view on 19th May
In the second example where previous periods are calculated, you would see your results on 28th April. This information will however be displayed on the Risk Dashboard:
Event Settings
Once you have chosen your calculation settings you can view the events for each category of Employee, Asset and Organisation.
Each Risk section has event groups which have a list of all the individual events included in that group. Each event has a default risk score/weighting, and all events are switched on as a default.
You can of course configure the events to suit your operation however, if you change the scores after your first period has been calculated, the change will only be reflected in future periods.
Employee Risk Event Groups
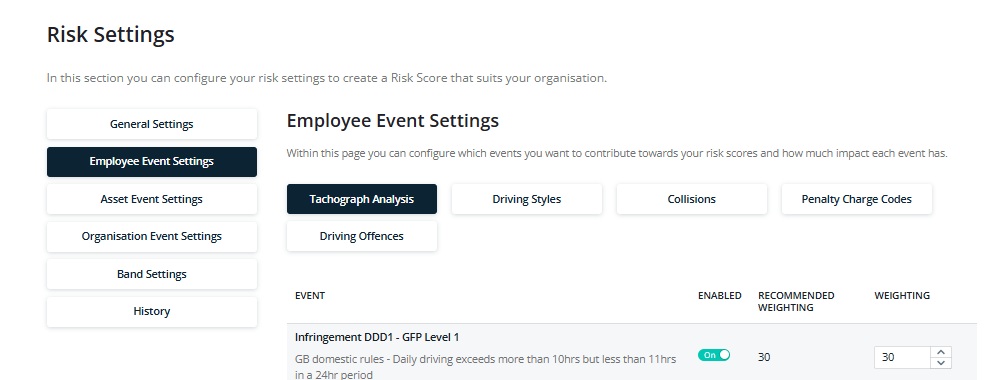
- Tachograph Analysis – Events are generated from drivers’ hours’ analysis that is carried out through Vision. The events include both drivers’ hours’ and working time infringements, faults and events as well as repeat infringements.
- Driving Styles – Events are generated from telematics integrations including Samsara, Isotrak, and Geotab. There will be some events shown that are specific to a particular provider and will only be triggered if you are using that providers product.
- Collisions – Information for this section comes from our own Collisions feature that allows you to add incidents to Vision. More information can be found here
- Penalty Charge Notices (PCN)- Information comes through from our own PCN service. This section highlights those PCNs that customers have highlighted are considered the fault of the driver.
- Driving Offences- Events are generated from Vision Licence check and Visions integration with TTC. Endorsements will be redacted where a user does not have permission to view licence checks.
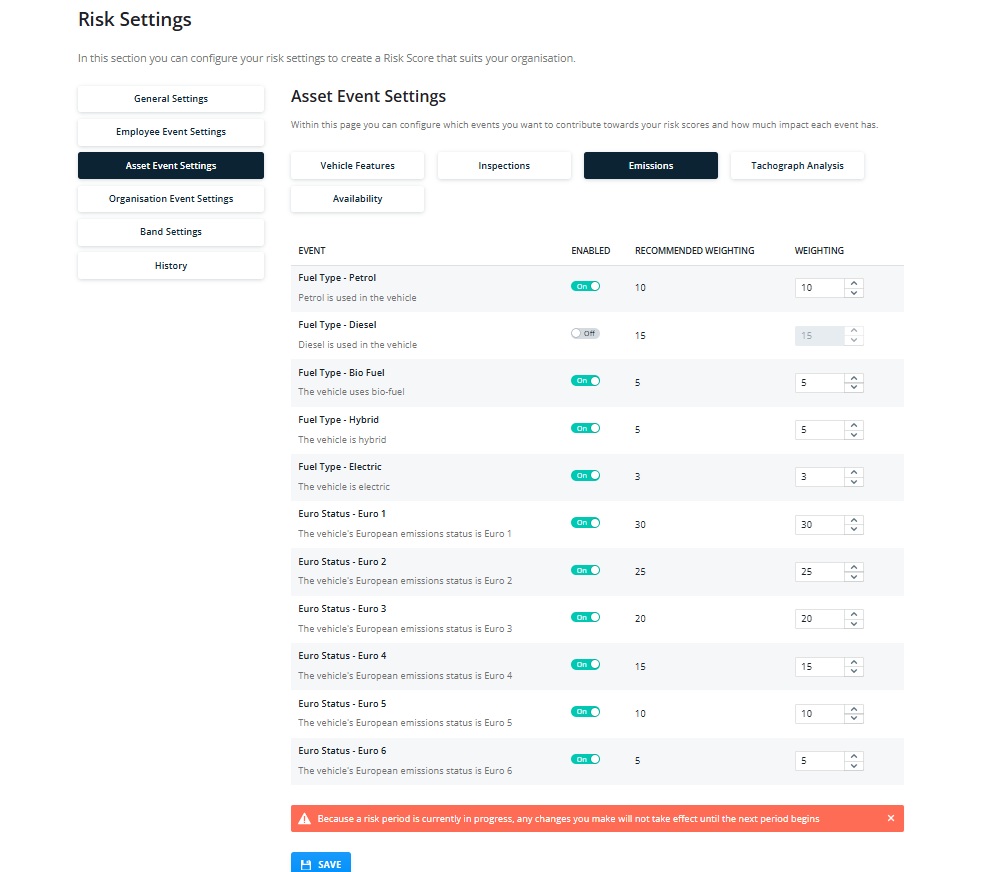
Asset Risk Event Groups
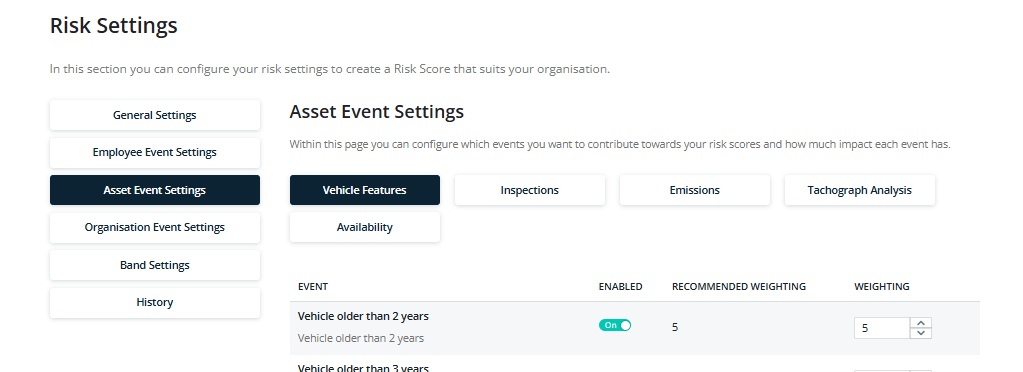
- Vehicle features- these events are created from a mixture of safety features added to vehicles through the asset profile, integration with the DVLA and tachograph uploads. For more information click here
- Inspections- Events are generated from MOT results which come through from our integration with DVLA as well as defects found by Logistics UK Vehicle Inspection Services and Walkaround checks carried out via the Vision Driver App.
- Emissions- This information comes from the DVLA integration.
- Tachograph Analysis – All information will come from tachograph downloads
- Availability – Information comes from use of the “Vehicle Off Road” setting in the asset profile.
Organisation Risk Event Groups
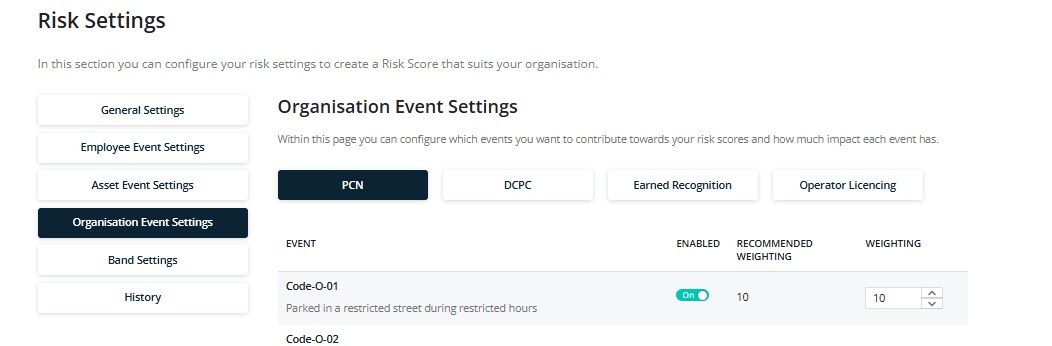
- Penalty Charge Notices (PCN)- Information comes through from our own PCN service. This section highlights those PCNs that customers have highlighted are considered the fault of the company.
- DCPC (Driver Certificate of Professional Competence)- Information comes from the training section in Vision. More information can be found here
- Earned Recognition – Analysed tachograph data is calculated against the Earned Recognition driver key performance indicators (KPI’s). You do not need to be part of the scheme to be able to measure your performance against these KPI’s. For more information click here
- Operator Licencing – These events are created from the Manage Operating Licence feature in Vision. More information can be found here
Band Settings
There are five Risk bands as shown below:
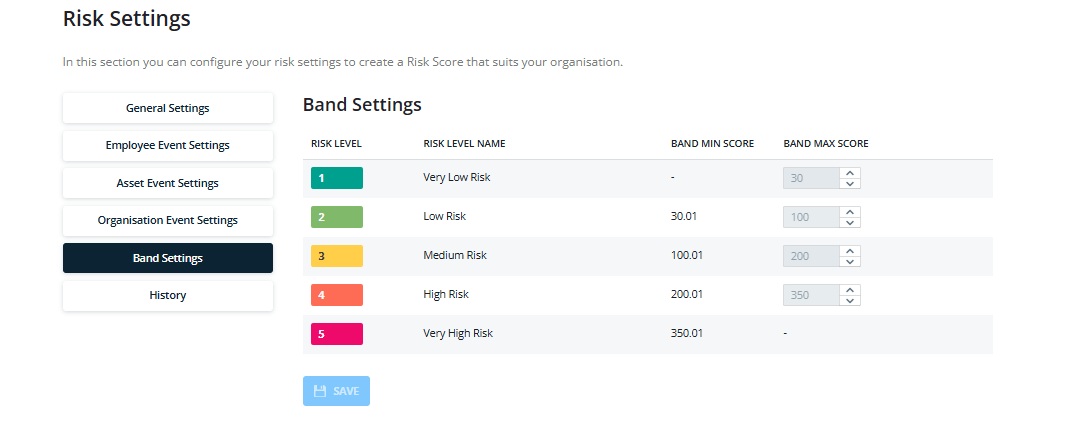
As with the events, there is a default setting which can be adjusted. Please be aware that if you adjust the score this will only affect those periods in the future, the change will not be applied retrospectively.
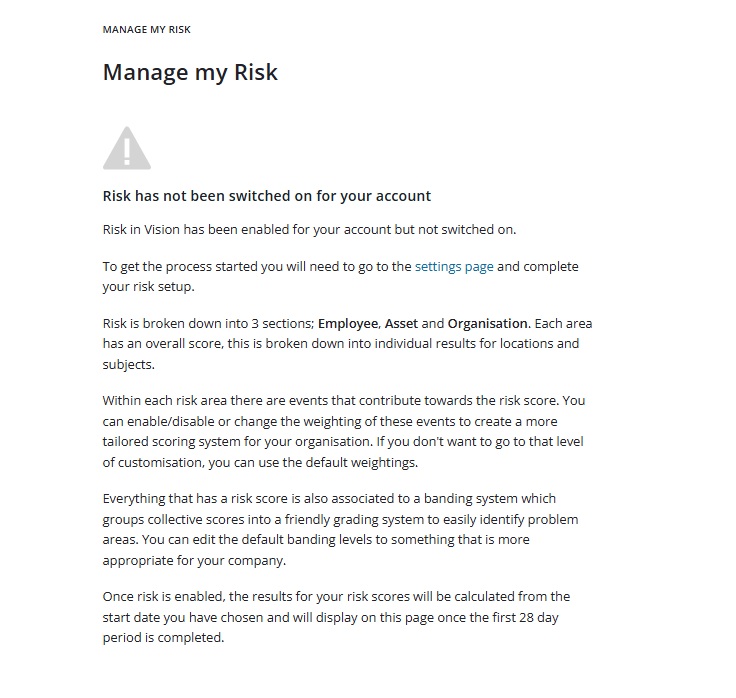
Once you have completed the Risk Dashboard will show you when your Risk Scores will be available:

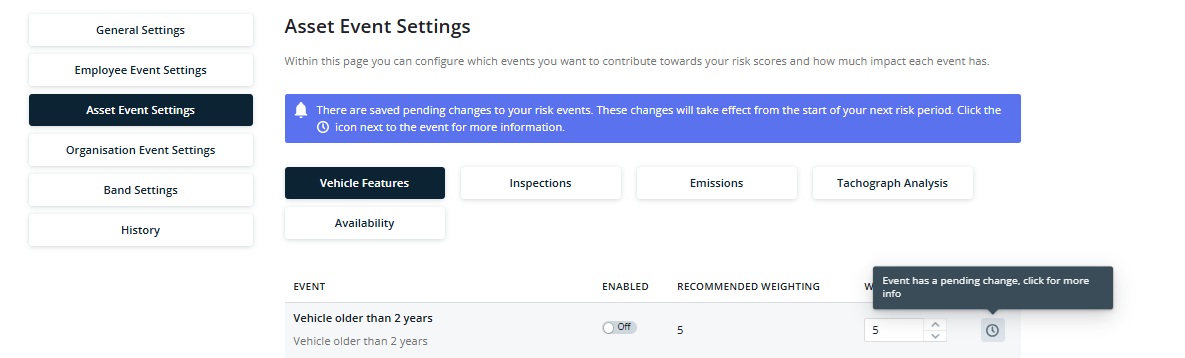
Making Changes to your Risk Settings
As described above, you can make changes to events either by turning them off or adjusting the weighting/score to suit your account. The changes will take place once the current period is completed and will affect only future periods. A banner will highlight this:
If you would like to stop your risk scores from calculating, go to “General Settings” and switch “Enable Risk” to “Off”
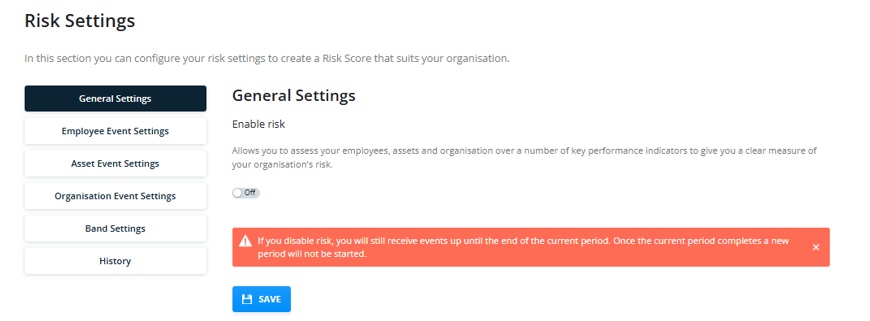
You will continue to see your Risk scores until the current period ends.
If you select the option to “Delete All Data” Risk scores will no longer be displayed:
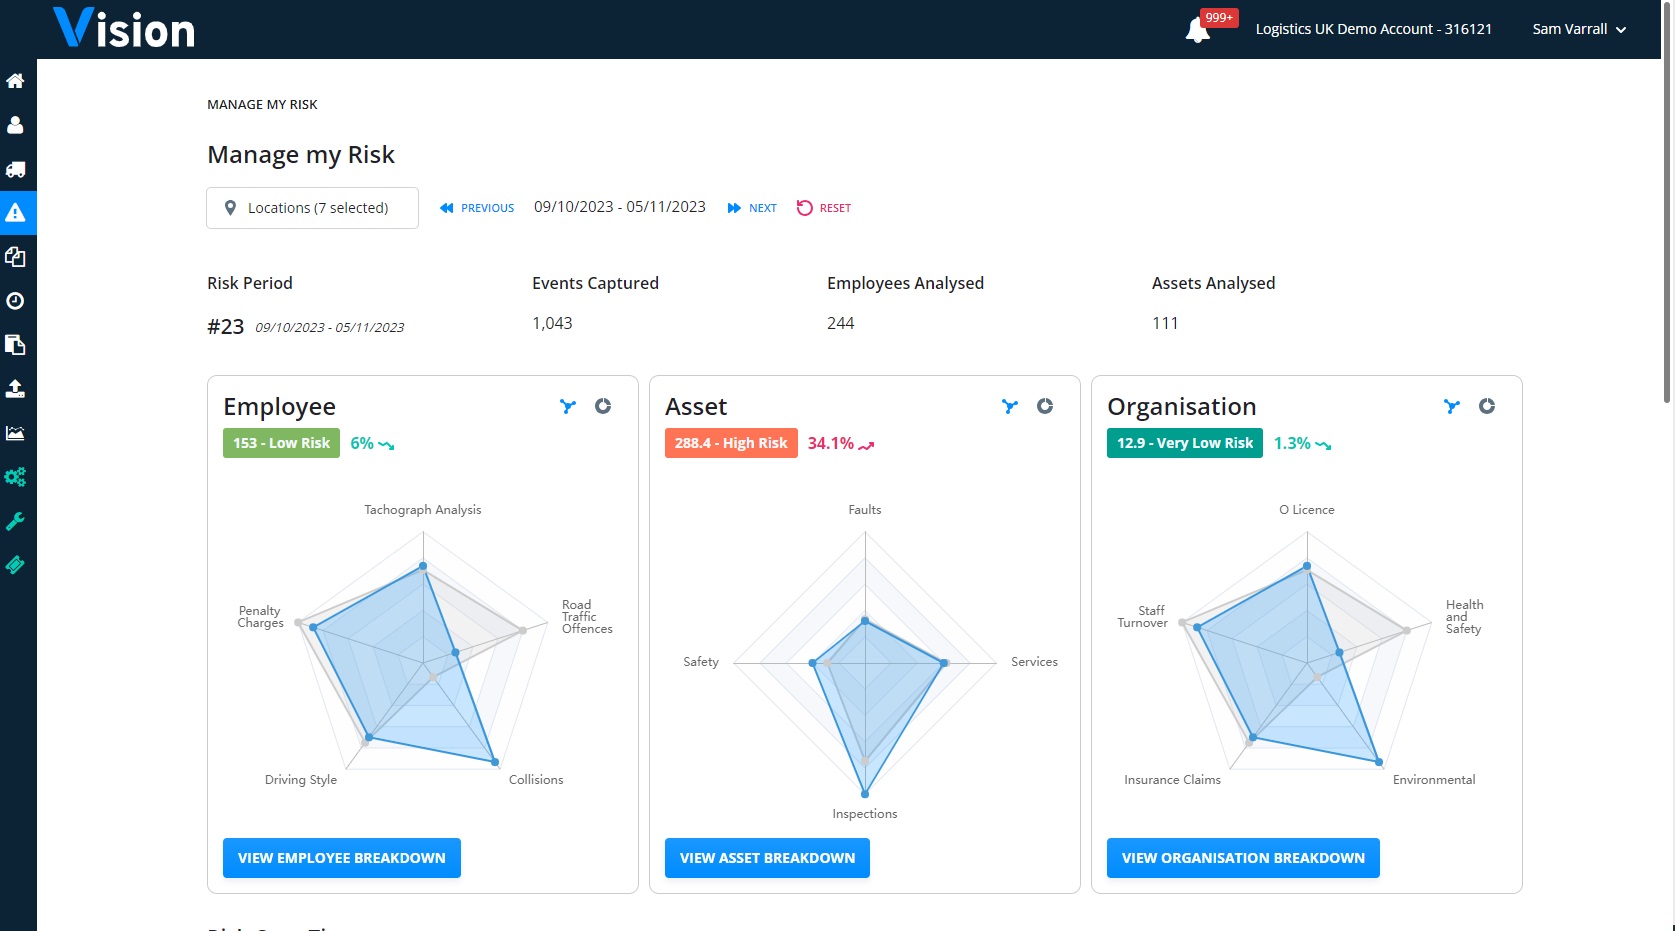
Risk Dashboard
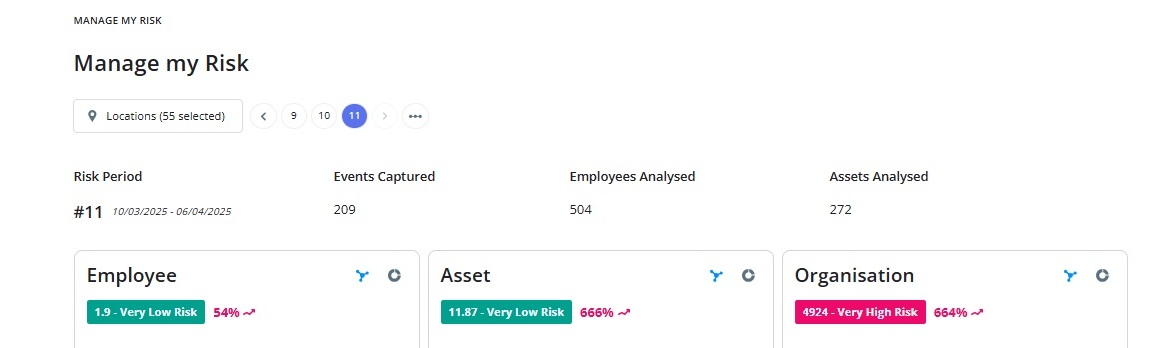
Once you have set up your account, and the first period has completed, you will see your results in the Risk dashboard. This available to those users with the Primary Contact, Company Admin and Advanced Editor Roles.
Results will only be shown for those locations that you have access to:

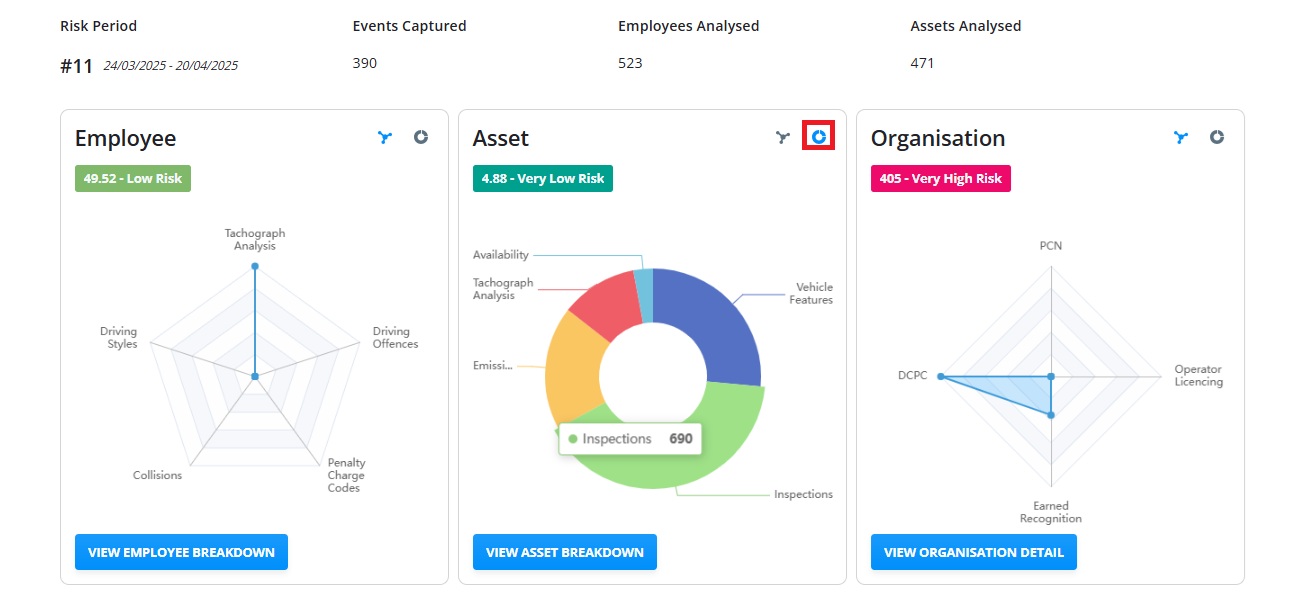
The default dashboards show a spider graph comparing the current and previous periods score. Hovering over the points will give you a breakdown of the events and scores included in each period and will compare the current period with the previous one. In addition, the pages will display your current score and highlight if it is worse or better than previous one:
If you prefer you can view the results in a pie chart by clicking the circular icon highlighted below:
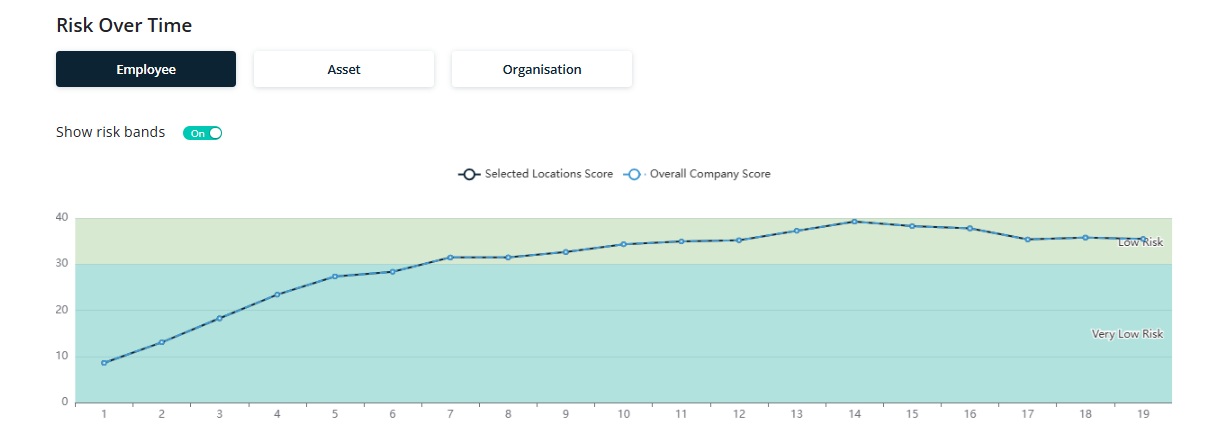
Moving down the page a trend graph indicates progress for each area over the completed periods calculated:
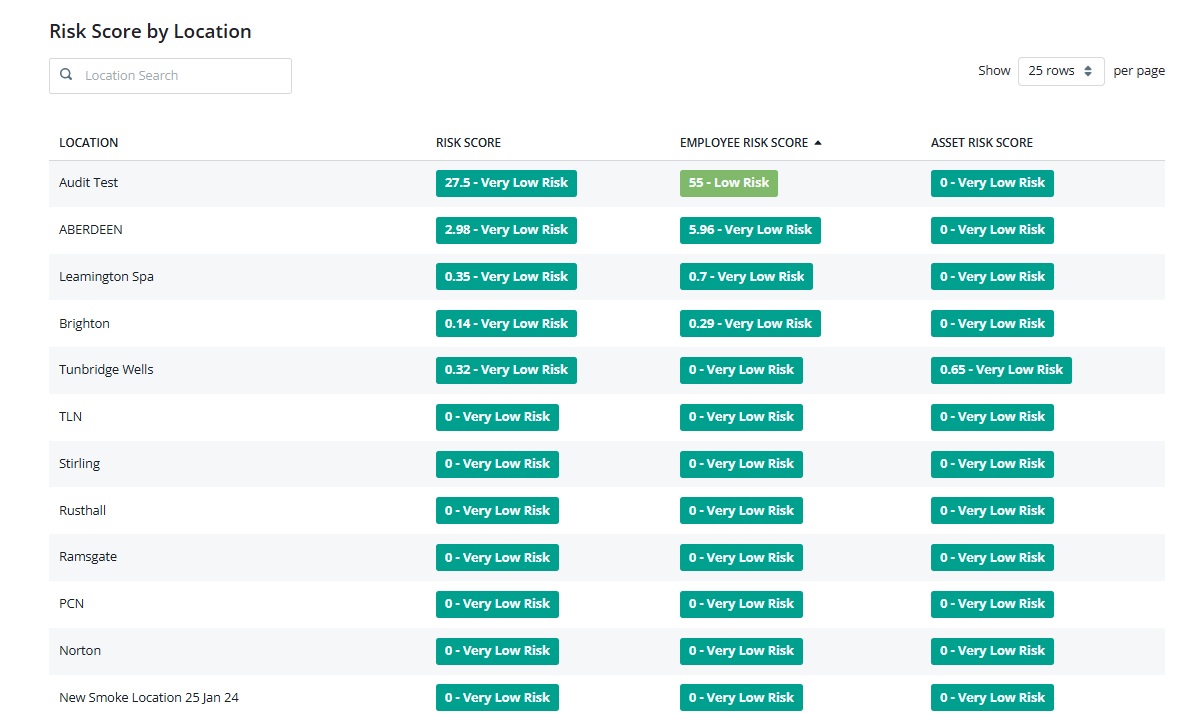
Below this your locations are shown in ranking order, worst first, best last. These columns are all sortable:
Risk Breakdown screens
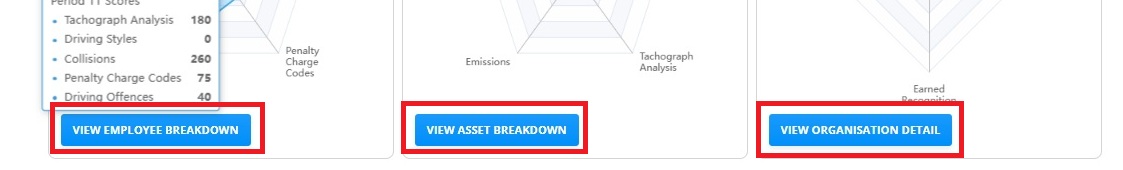
To view the data in detail, click the “View Employee/ Asset/ Organisation Breakdown” button:

This will take you to the risk detail. This works in a similar way for each Risk type. For the purposes of this document the examples are from the Employee Breakdown:
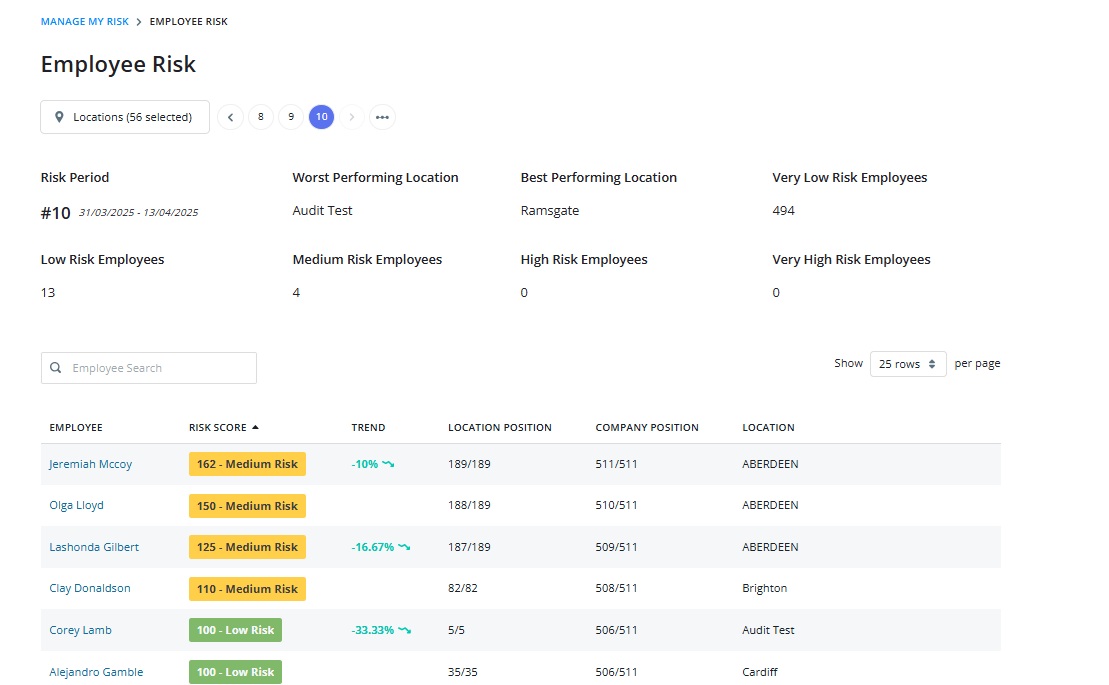
The page summarises all the information for the period selected, ranking the drivers worst to best with all columns sortable.
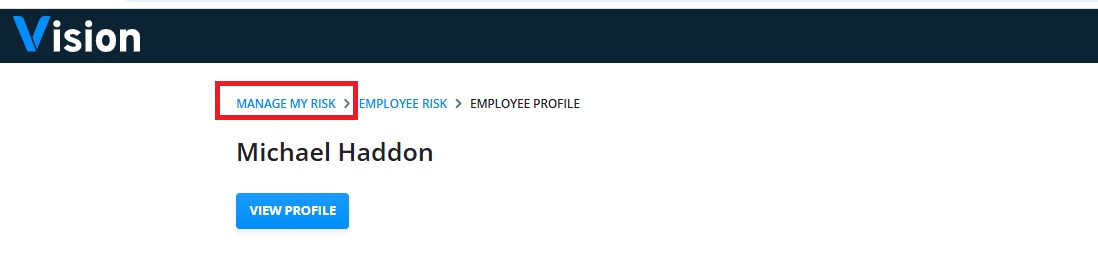
To get detailed information on the employee, click their name to show a breakdown of their performance across all periods:
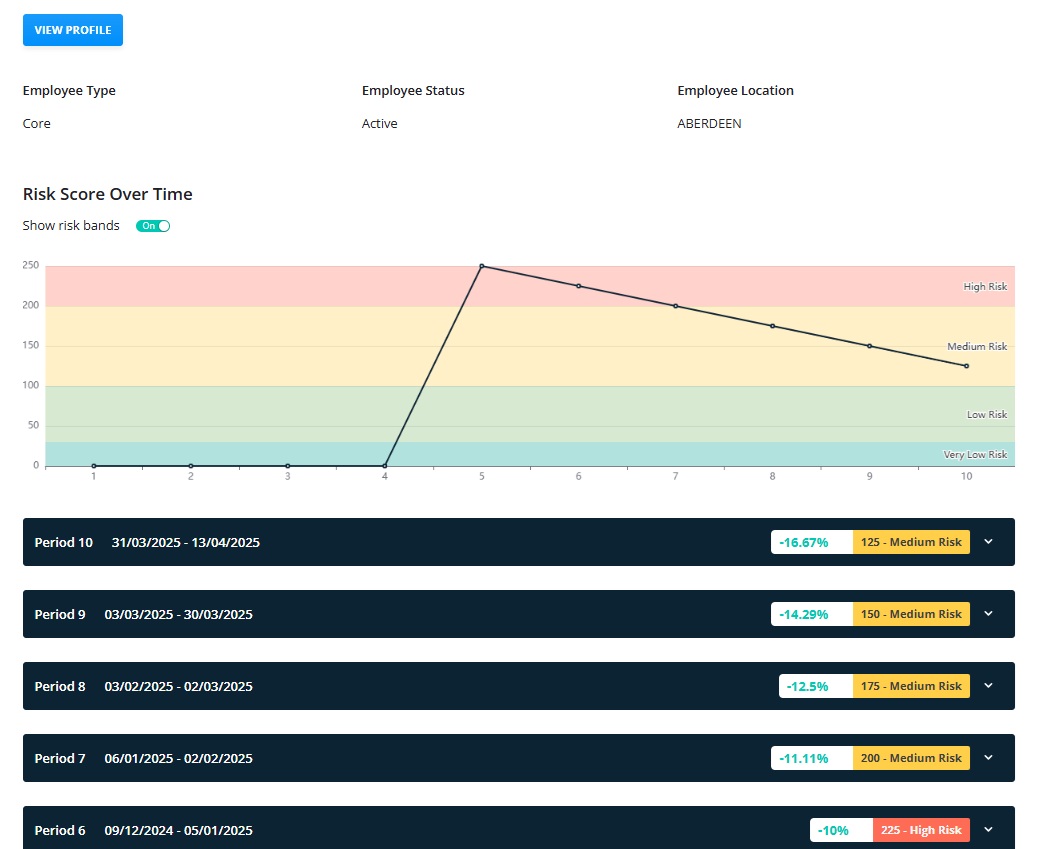
Each period can be opened to show the types of events and the scores incurred:
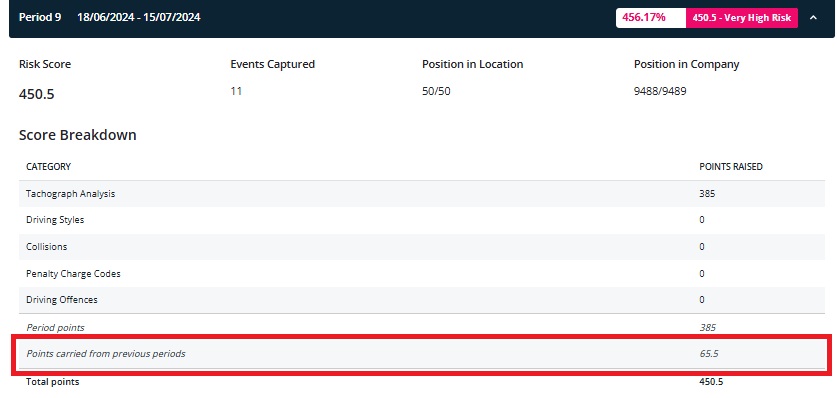
The area highlighted in red shows the points carried over from previous periods, this can be configured but defaults so that the points decay over 10 periods for example:
- Period 1, The driver receives a total of 100 new points
- Period 2, 90 points from period 1 would be carried over
- Period 3, 80 points from period 1 would be carried over
- Period 4, 70 points from period 1 would be carried over and so on.
Details of the specific events are listed below the summary:
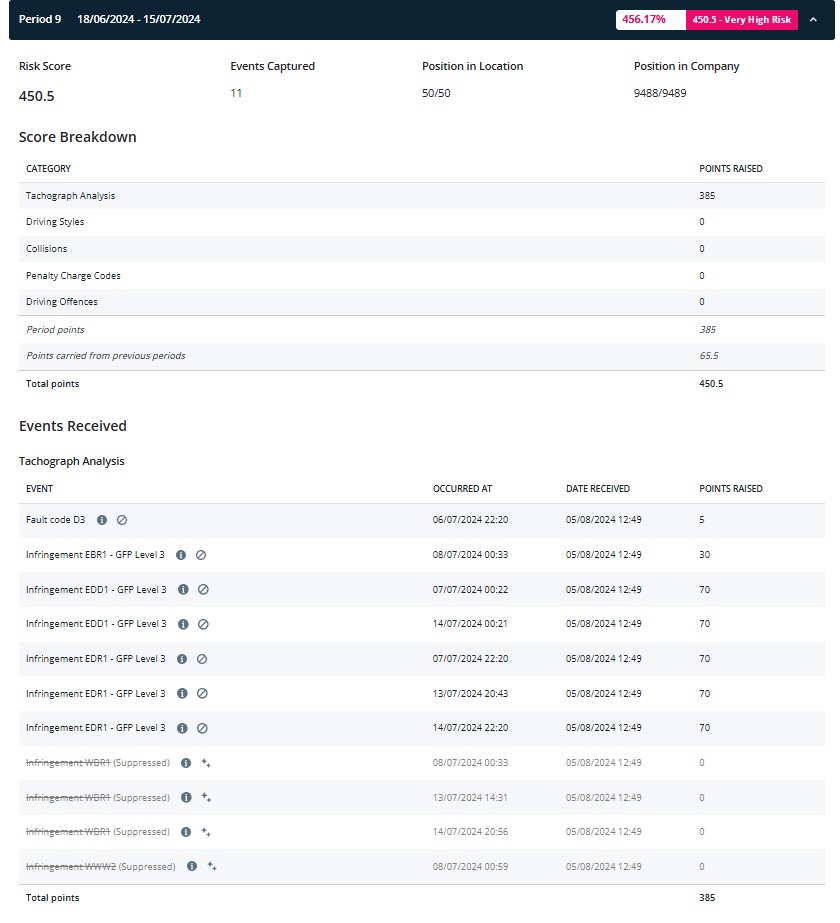
Events will show in the period in which they were received in Vision although the dates will display the date on which they occurred as well as the date that they were received.
The listing also includes an option to supress events. This is only available to those with the Primary contact or Company Admin role. This tool is fully audited and may be used where an event has been investigated and found to be caused by extenuating circumstances:
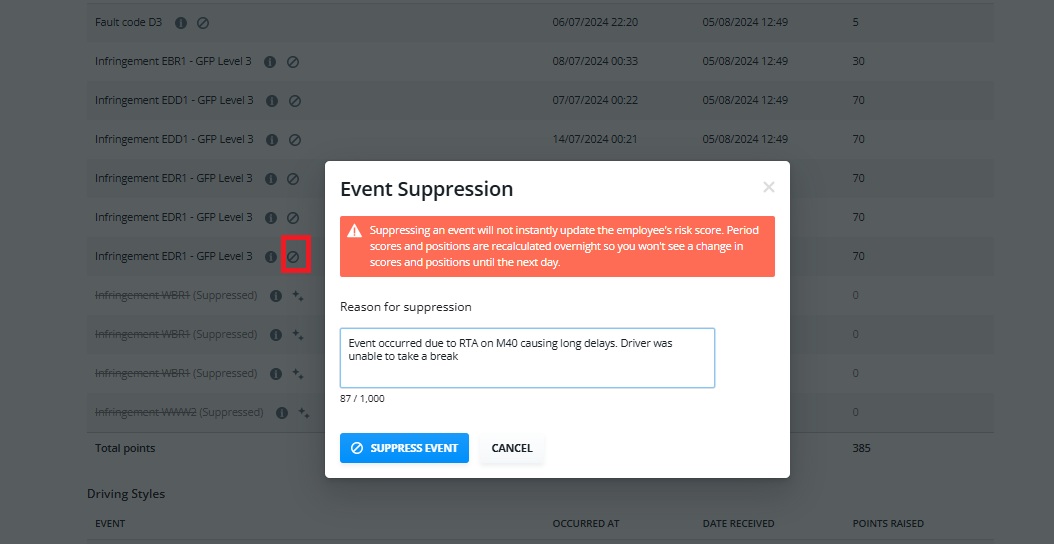
The event score will then be removed from the total following an overnight calculation.
If the suppression took place in error, then the event can be unsuppressed.
Scores for each asset and details of each risk period for Organisation will be displayed in a similar way by returning to Manage My Risk and clicking the “Asset/Organisation Breakdown” button: