Combined Infringement, Event and Debrief Dashboard
Monday 26 June 2023
Following feedback from several customers we have created a combined overview of our infringement and debrief dashboards which benefits from the following:
- One screen showing both graphical and tabular data
- Infringement summary, detail and debrief summary information all in one place
- Links directly to the day detail page
- Filters available that effect all the dashboards
- Snap tools to show hierarchies
- Tooltips to show monthly details of infringements and debrief information
This new dashboard is available to all companies that have the Tacho dashboards enabled and who have the roles of Advanced Editor, Company Admin or Primary Contact
Accessing the Dashboard
Go to the Tacho Dashboard tile or Dashboards sidebar option:
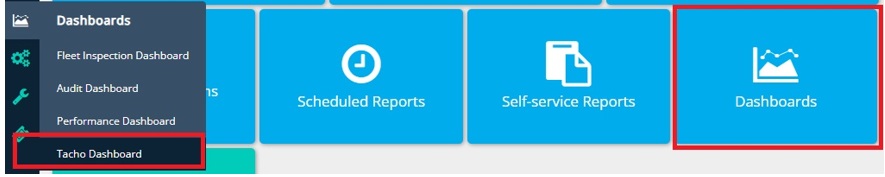
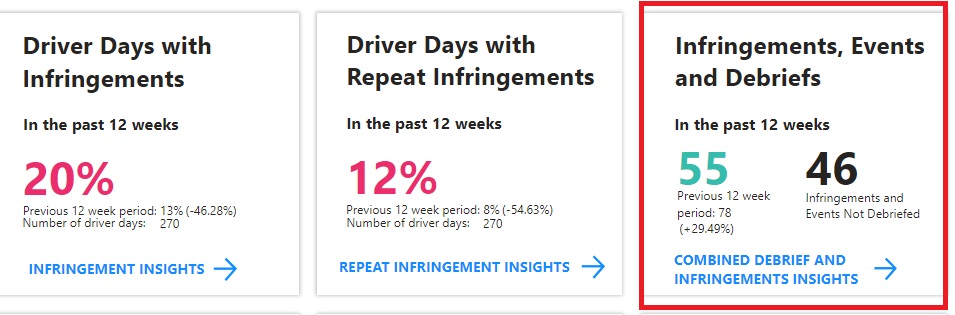
Select the Combined Debrief and Infringement dashboard insight link:
General information
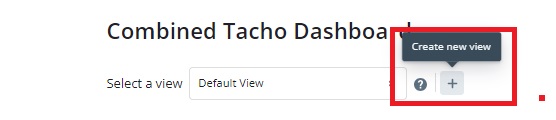
On opening the dashboard, you will see an option to set bespoke views, available only to those with the Company Admin or Primary Contact role.
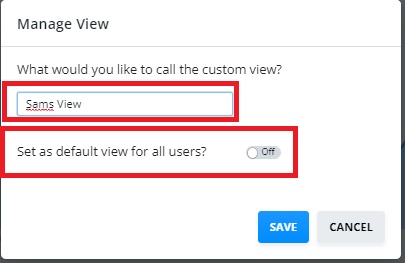
To set a custom view simply select the pages, filters and or date ranges on the page you would like to “Bookmark”. Click the “+” icon name your view and decide if you would like to set that view for all users:
You will see blue icons on the top right-hand side of the page:

These will allow you to:
- Reset the page
- Expand the page to full screen
- Print the page
- View details of all the tacho codes which will open in a separate tab
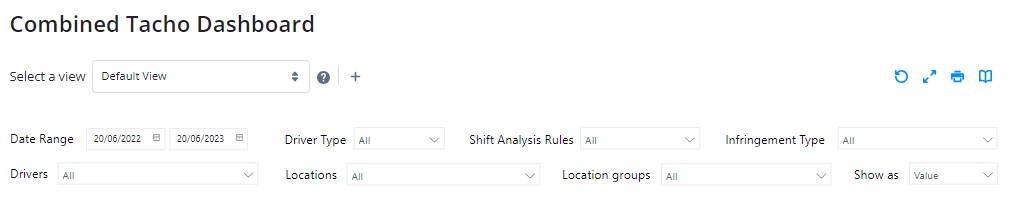
Filters
The filters at the top of the dashboard effect the data displayed in all the screens. You can view information as follows:
- By date range
- Driver type
- Shift analysis rules, i.e. EU, Domestic etc.
- By specific infringement type and events
- By driver
- By location
- By location groups (if hierarchies are set up)
- Show as a value, percentage or average, although the average will not show for the debrief summary as they aren’t applicable:
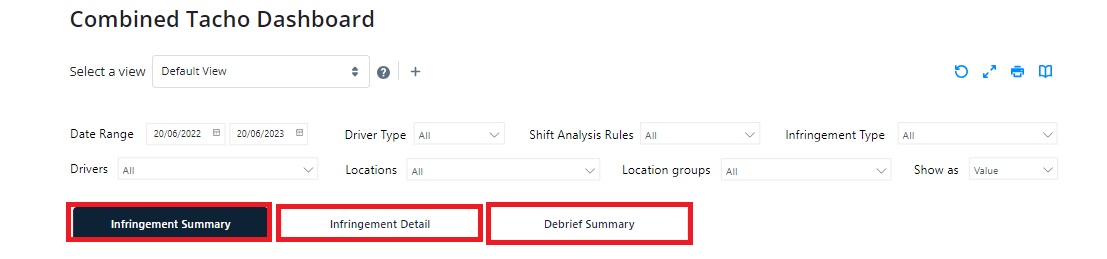
You can switch between the different screens by selecting the relevant button for:
- Infringement summary
- Infringement detail
- Debrief Summary
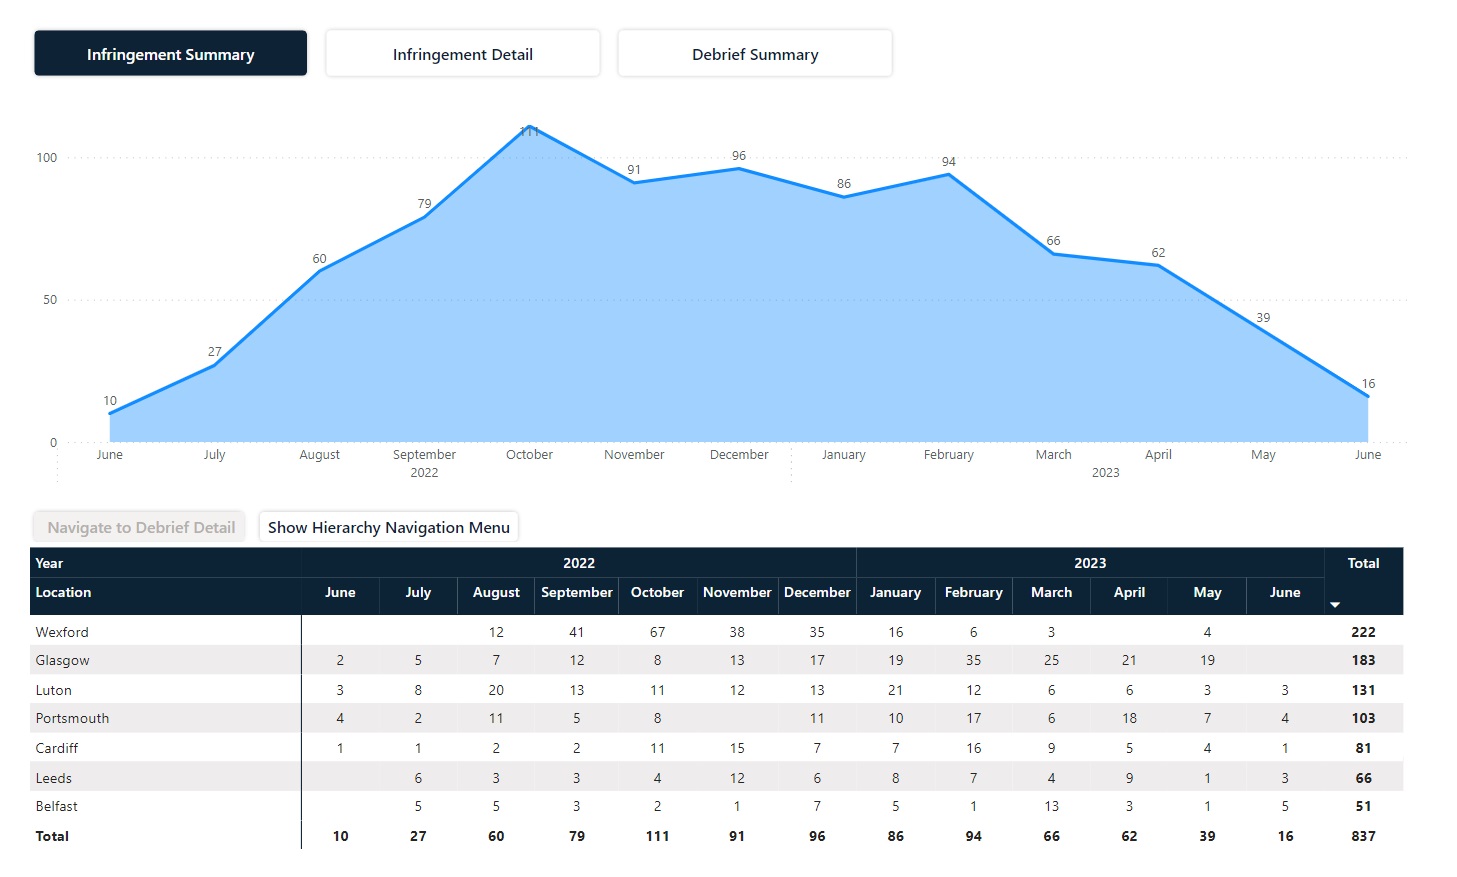
Infringement Summary
This screen shows the total number, average or percentage of infringements incurred for the last 12 months. The default display shows the last 12 months data, by value at location level:
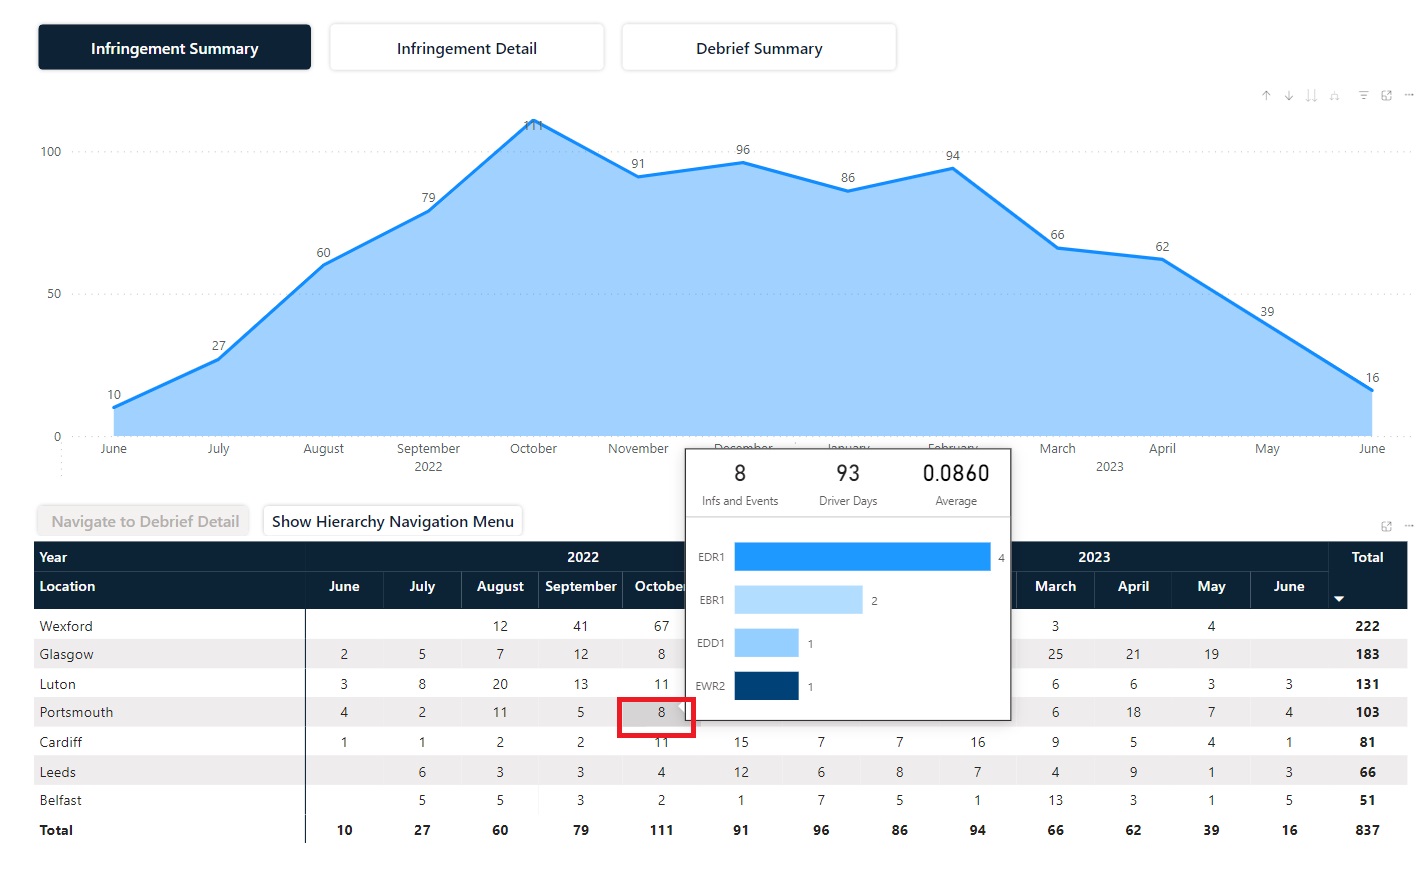
Clicking a point on the graph will give details of numbers, average or percentage of infringements for each location for that month:
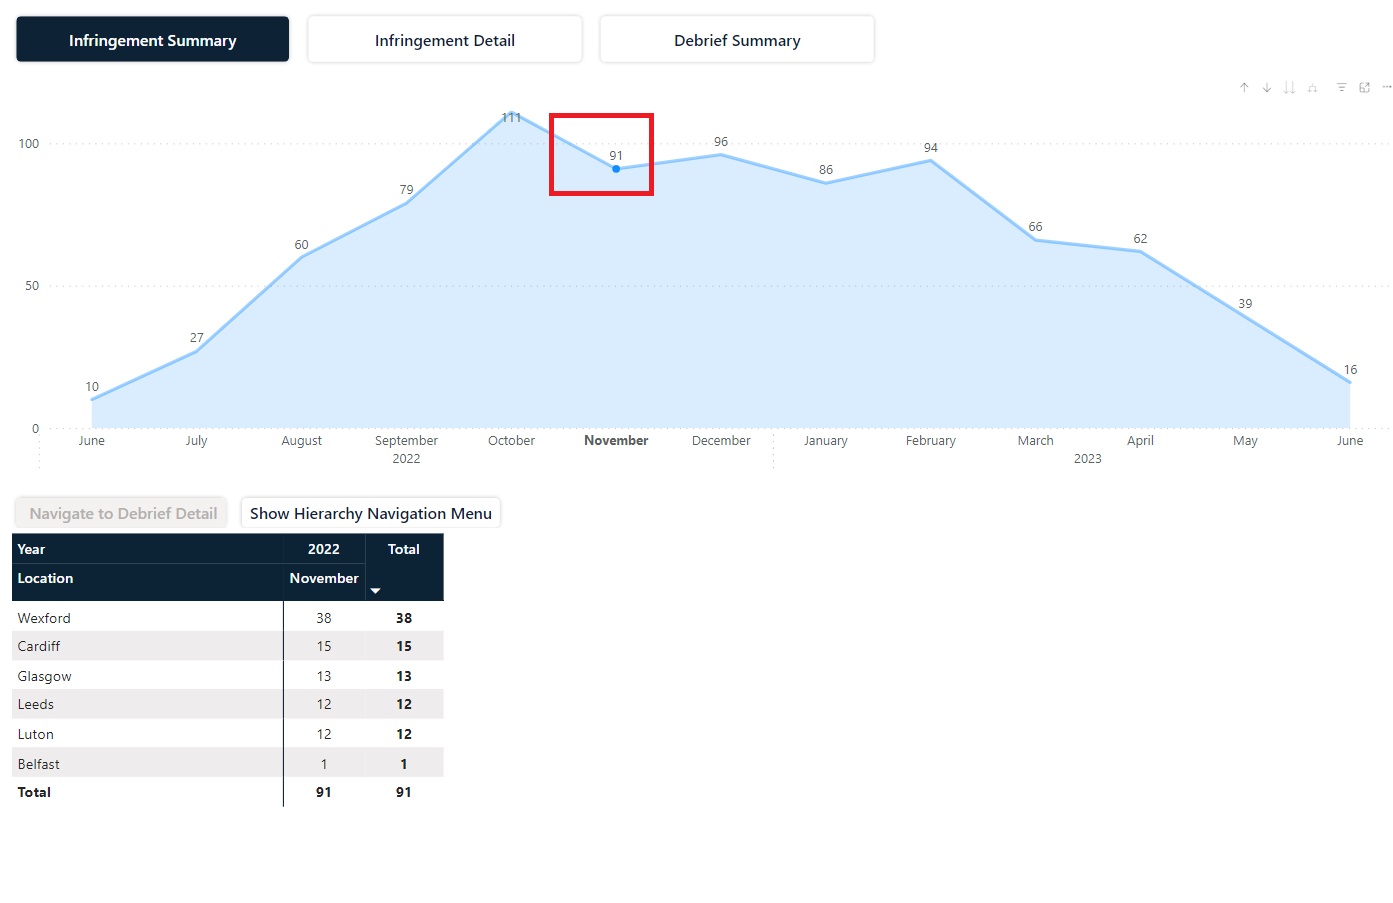
Click the selection made on the graph again to revert to the last 12 months view.
If you hover over a particular number in the table a tool tip will show the breakdown of each of the infringements:
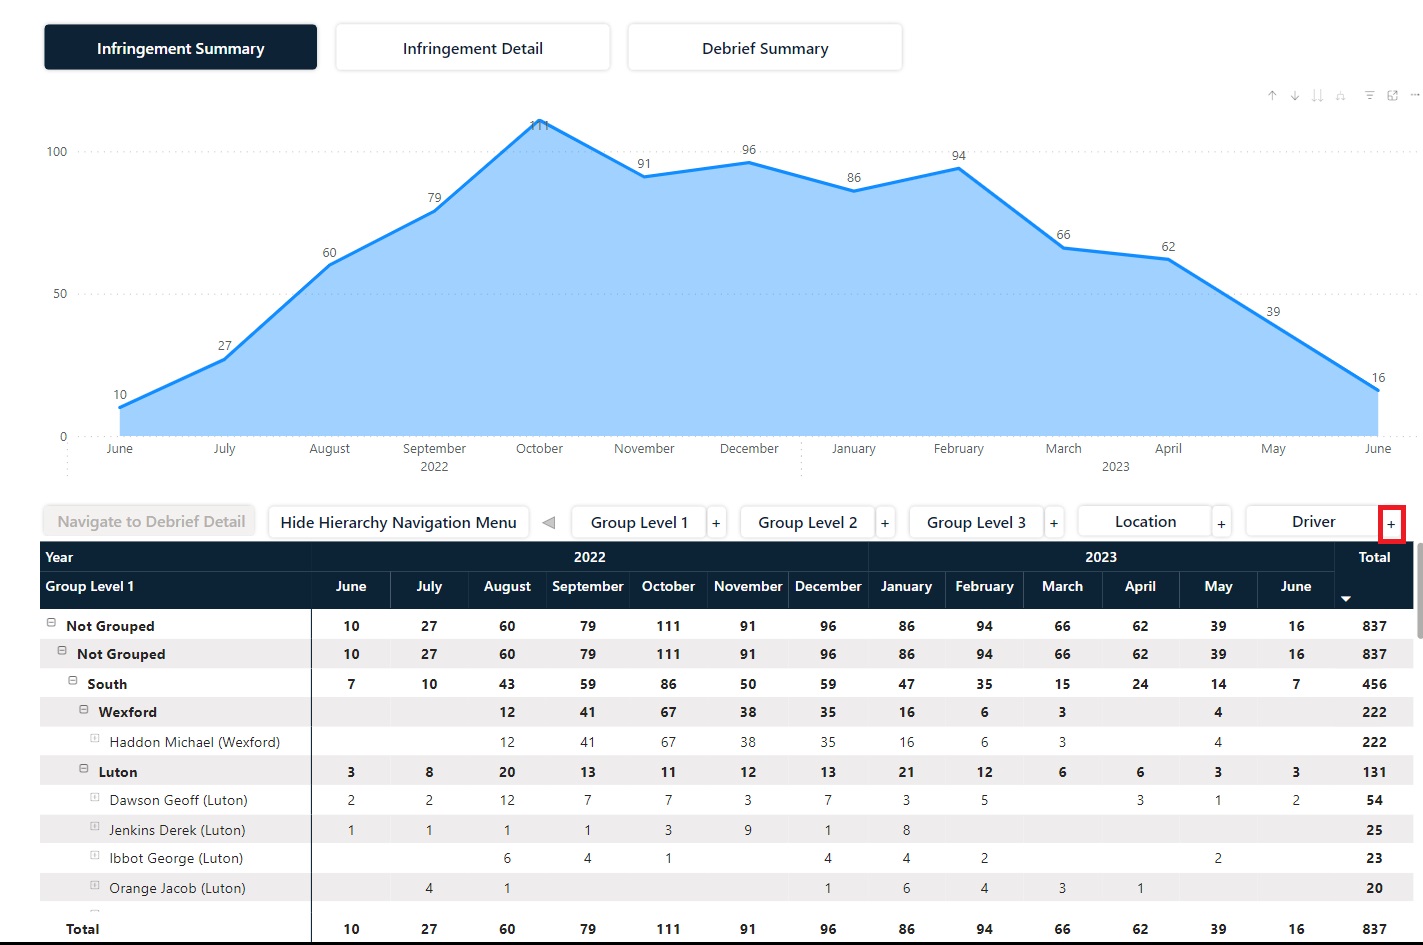
If you have hierarchies set up, you can view the information at hierarchy level by selecting “Show navigation hierarchy menu”
Clicking the “+” icon against each level gives a view of the hierarchy showing totals at all levels. In this example you can see summary totals at all levels including driver:
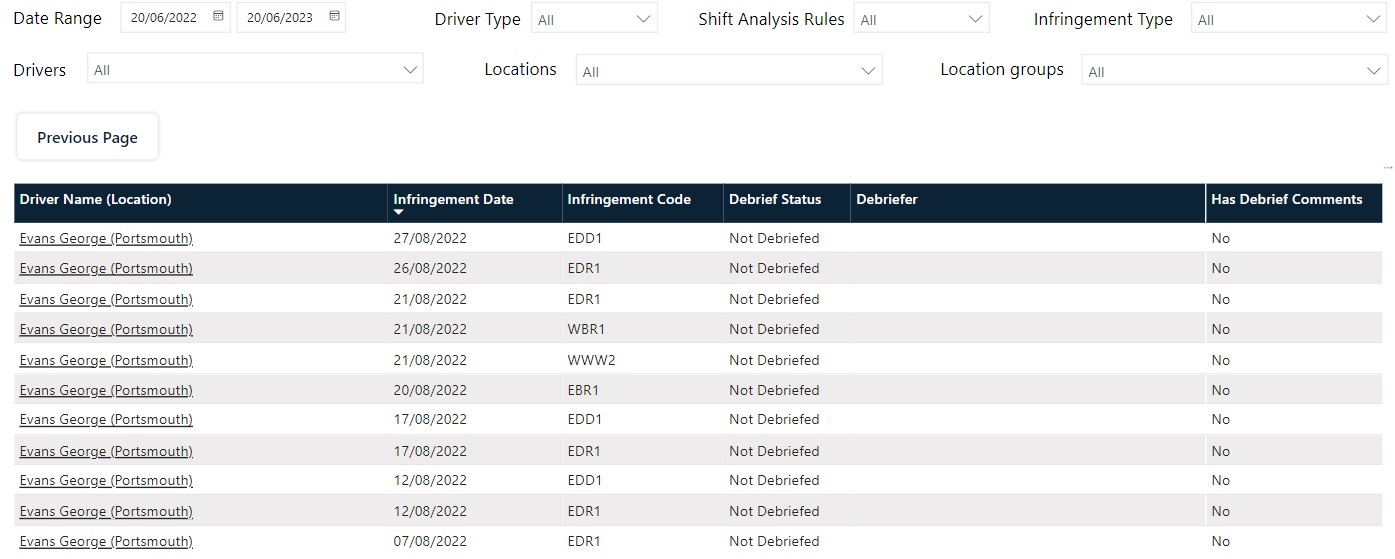
To drill to see details of drivers debrief information, select a figure in the table at either location or driver level and select “Navigate to driver debrief:
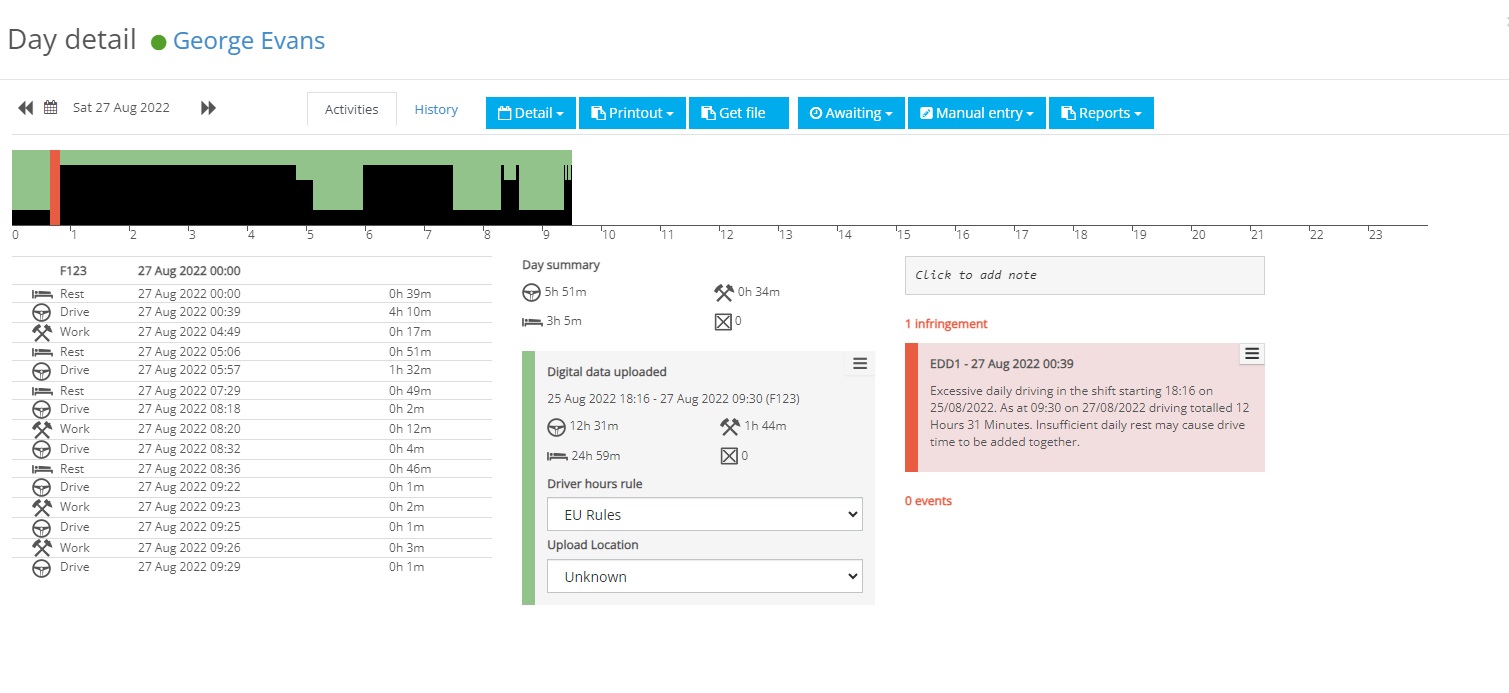
Clicking the driver’s name will take you to the day detail screen for that date in Vision:
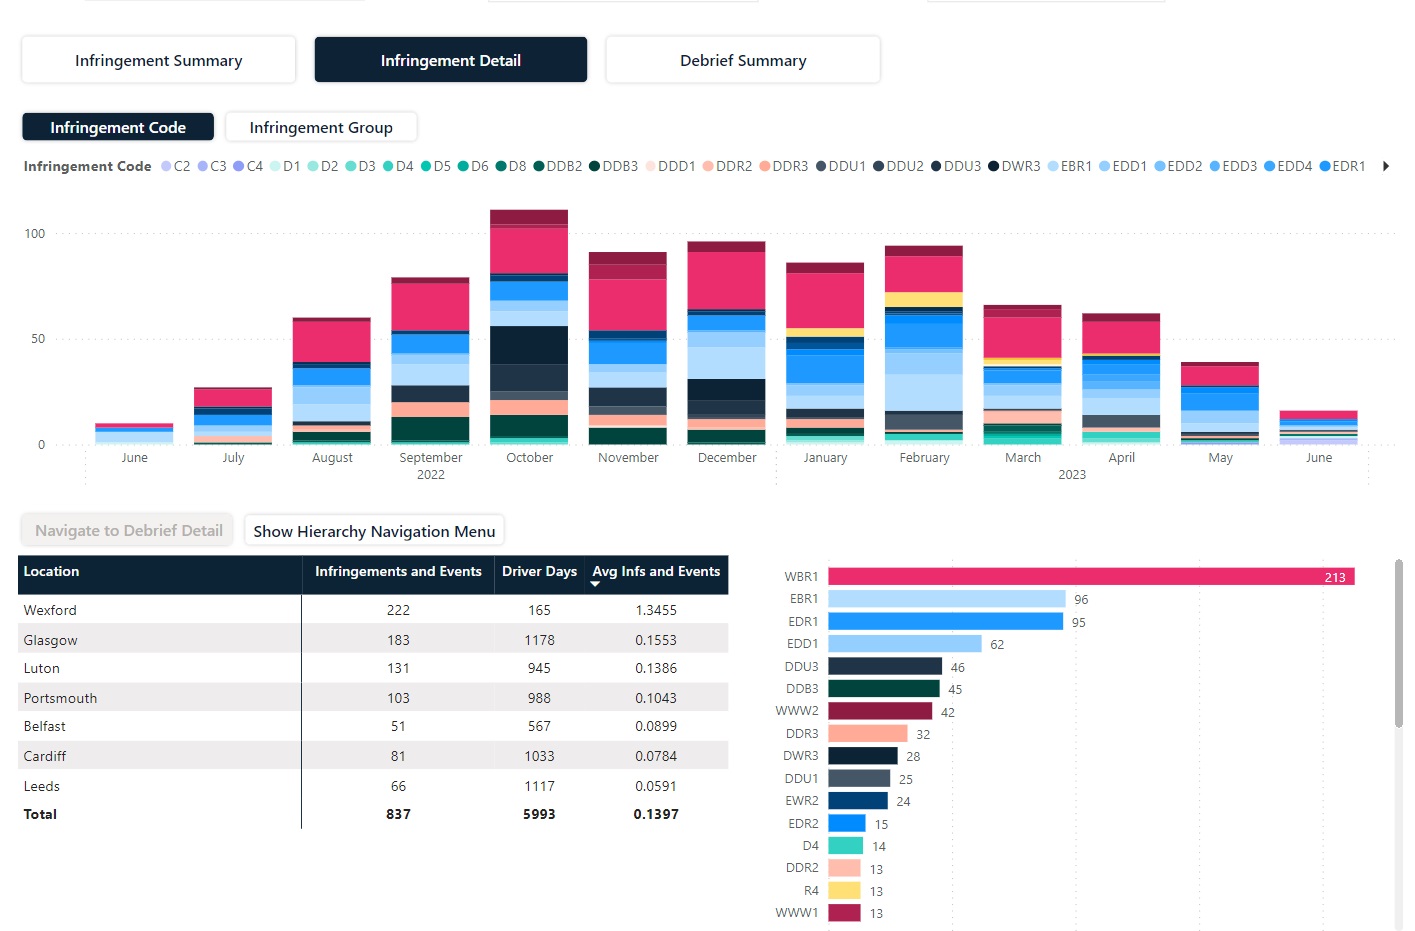
Infringement detail
This screen shows a breakdown of different infringements that are shown by individual infringement or by infringement group:
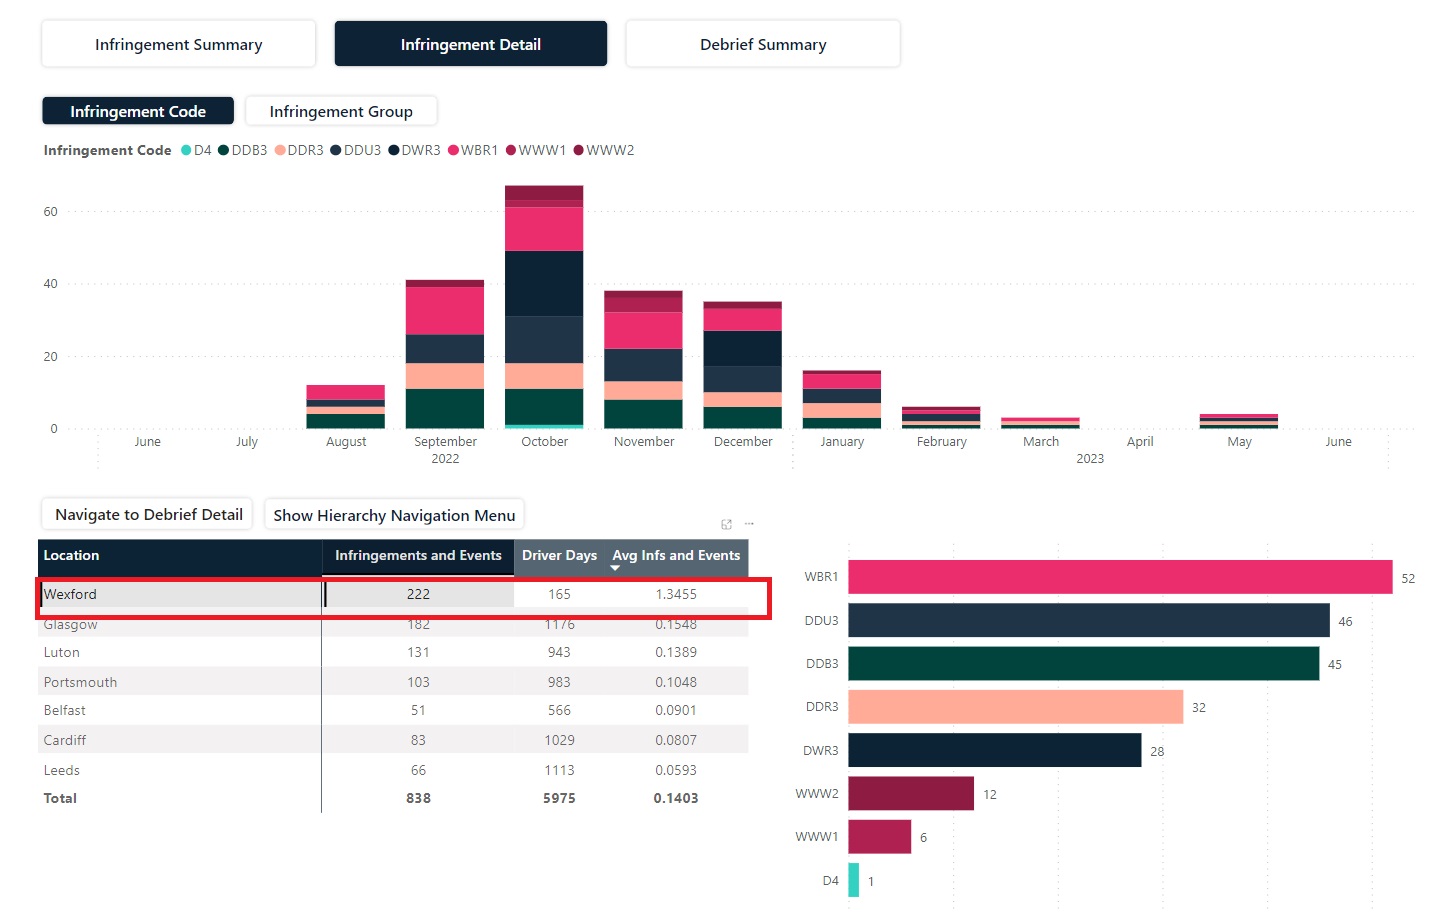
All 3 sections work interactively, so if you select the figure in the table for a specific location the graphical data will change to reflect results for that location:
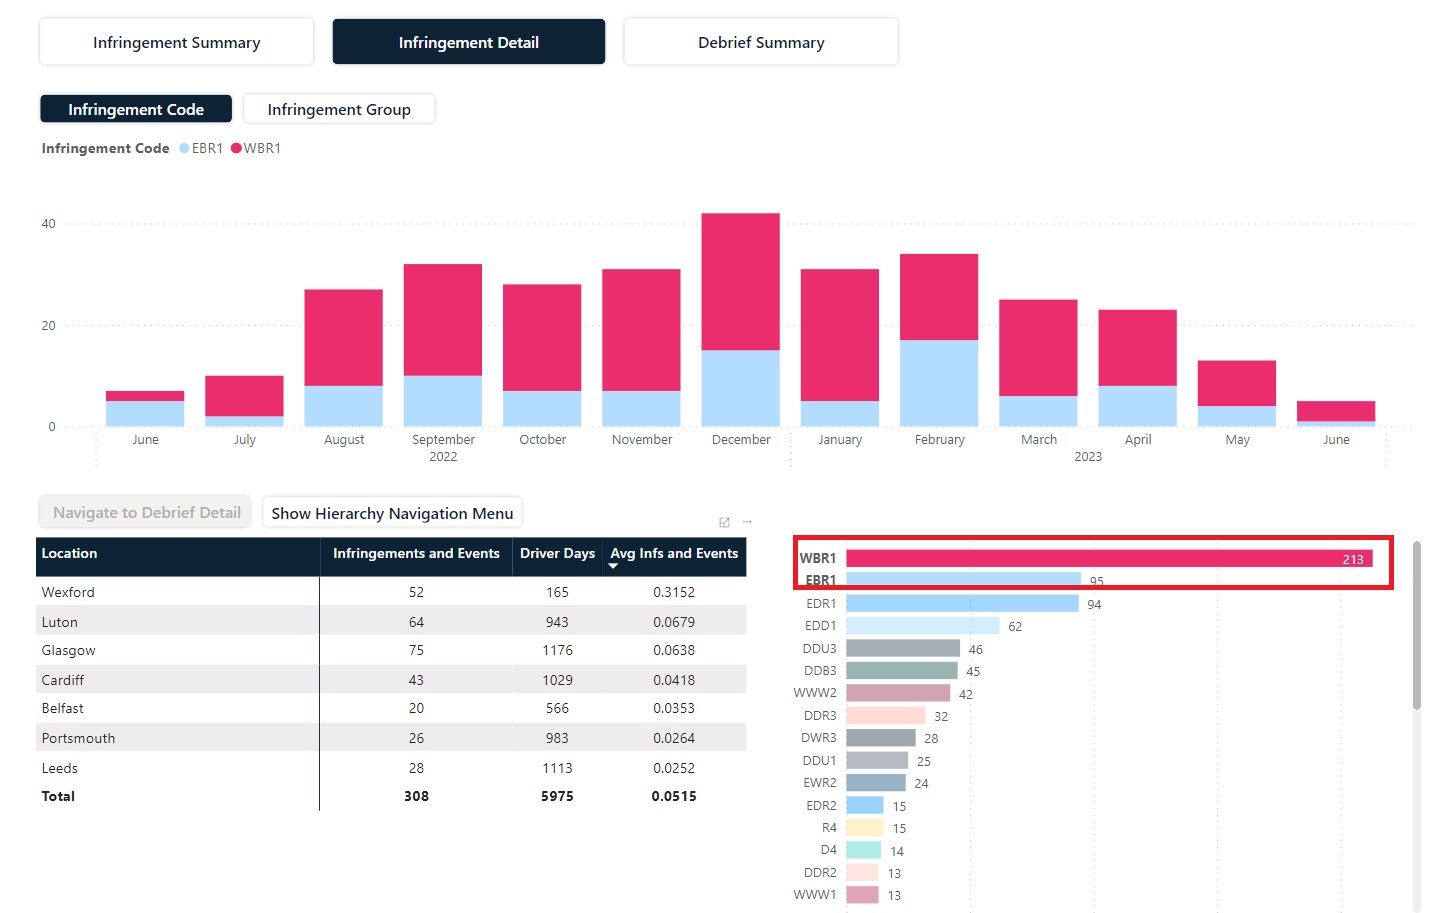
You can also see trends for specific infringements by clicking a specific or multiple infringement types on the graph on the right hand-side of the screen:
The hierarchy tools and the links to drivers debrief detail are also available on this page and work exactly as described in the Infringement detail section.
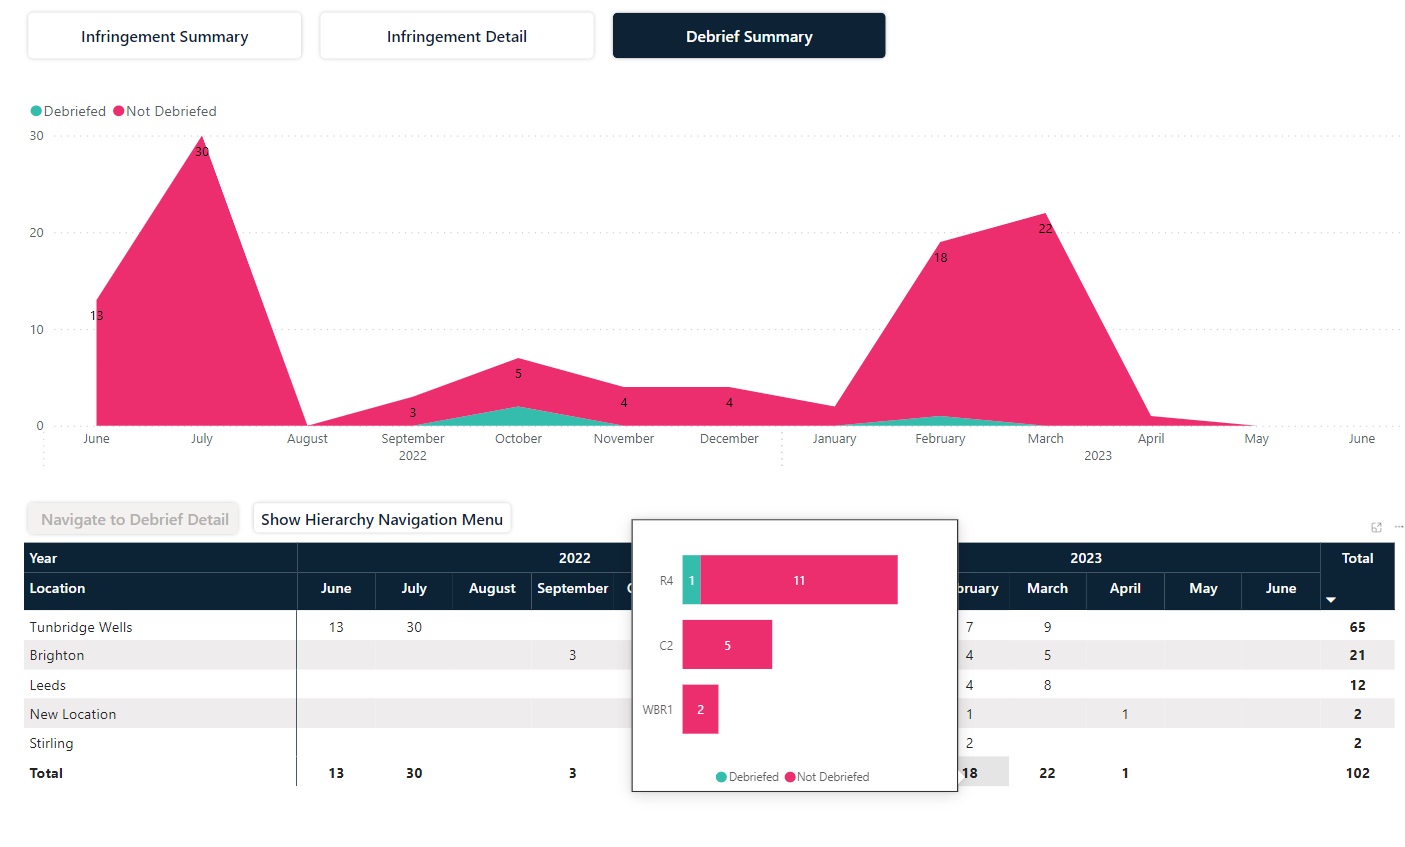
Debrief Summary
This screen shows the numbers of infringements debriefed and not debriefed. The graph shows the total number of infringements, showing red where they have not been actioned and green where they have been:
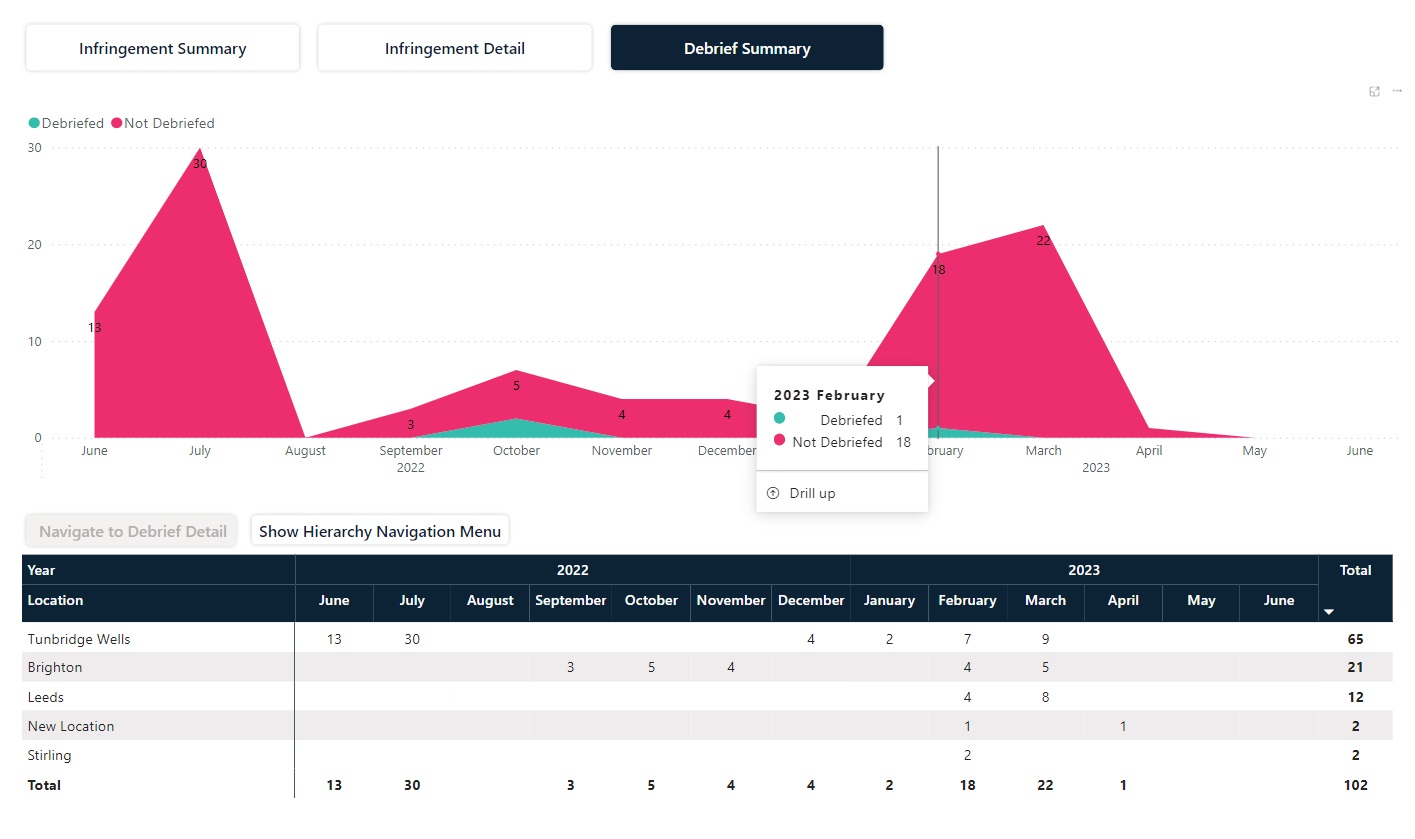
A helpful tooltip on the table shows which infringements are outstanding and which have been debriefed:
The hierarchy tools and the links to drivers debrief detail are also available on this page and work exactly as described in the previous sections.
