Walkaround Check Dashboard
Monday 15 January 2024
To display results from Logistics UK’s Walkaround check app in the most effective way, have created a new dashboard reporting suite.
This is available to all companies that have Logistics UK’s Walkaround checks and Driver App features enabled as part of their service.
Accessing the Dashboard:
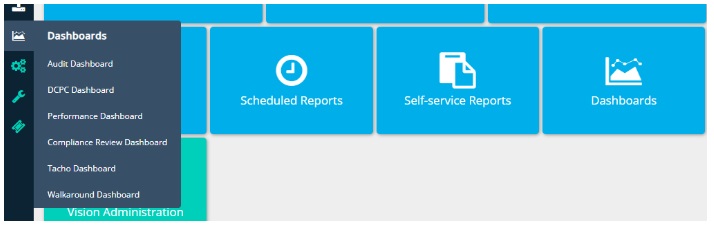
Go to the Walkaround Checks Dashboard tile or Dashboards sidebar option:
Tabs
The dashboard will by default open to the summary screen.
There are additional tabs for:
-
Employee
-
Asset
-
Overall Trend
-
Details
Filters
The filters that appear below the tabs effect the data displayed in all the screens. You can view information as follows:
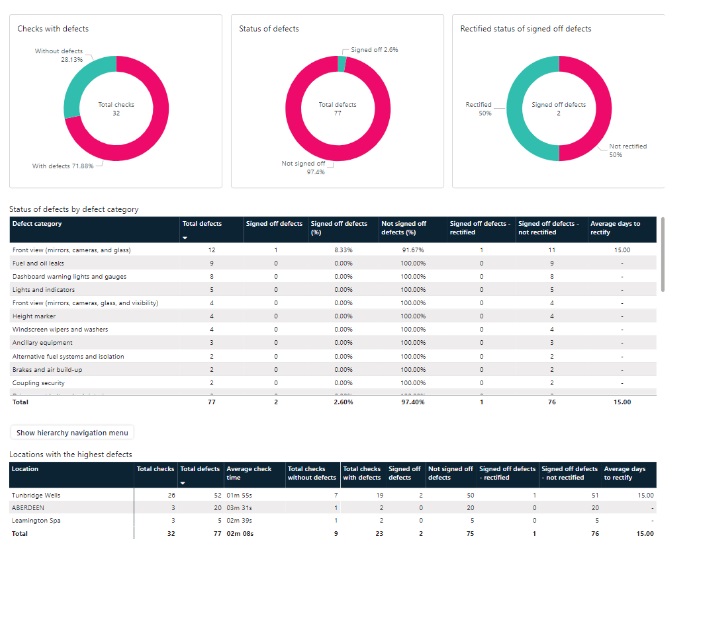
Summary:
The summary tab illustrates the checks with and without defects, status of the defects found, and rectified status of signed off defects.
The tables below the graphs show the status of defects by defect category and a view of the locations with the highest defects:
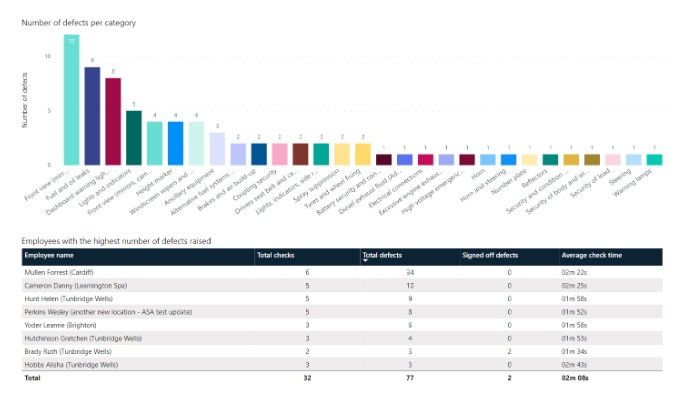
Employee:
The employee tab shows the number of defects by category in a chart, and a table showing the number of employees who have raised the highest number of defects.
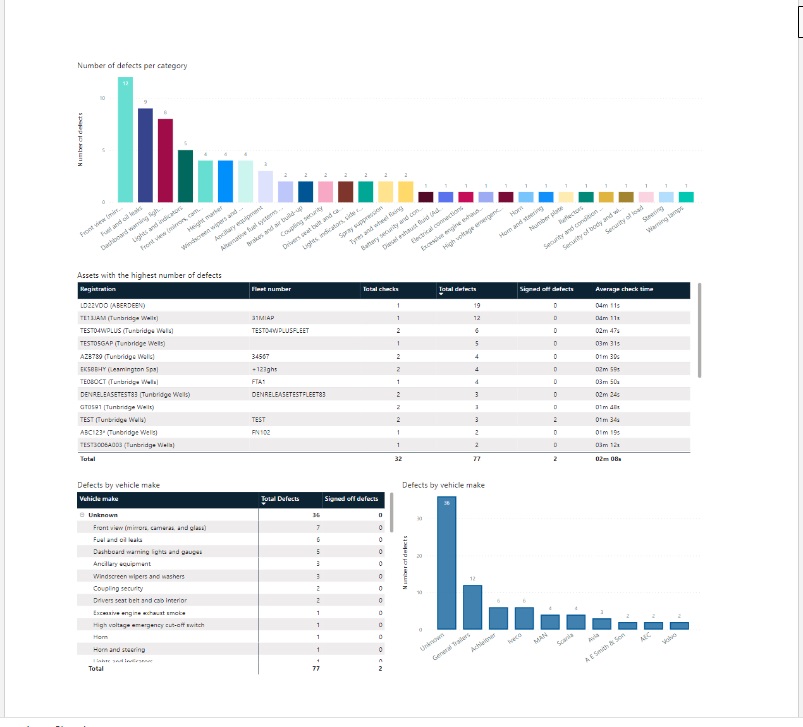
Asset
The asset tab shows a similar view to employee, the number of defects by category in a chart, and a table showing the assets that have had the most defects raised against them.
If you have set the vehicles make in the asset profile, there is a chart to show Defect categories by make.
Any assets with no make set are shown in the unknown category.
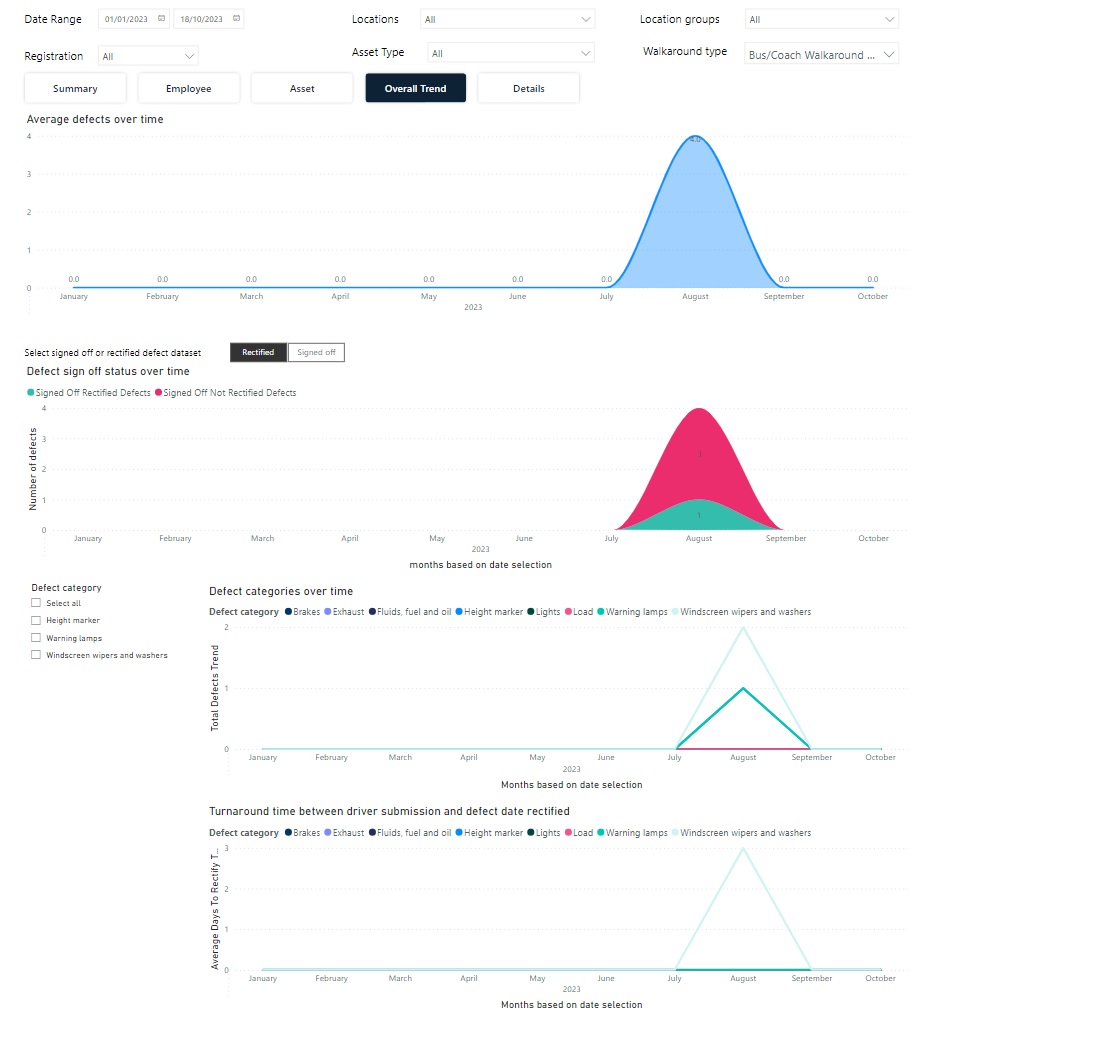
Overall Trend
The tab shows trend graphs for the following:
-
Average defects over time
-
Status of defects over time - can be switched between signed off status and rectified status. There is also a category picker to allow comparison of certain categories.
-
Defects per category over time – defaulted to 5 categories, but this can be increased. Colours do not necessarily remain fixed for defect categories as the user adds more.
-
Average time taken to rectify defects.
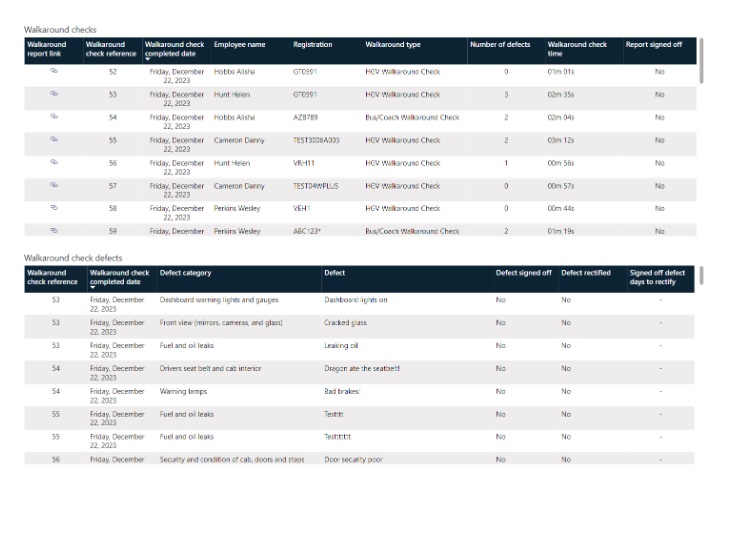
Details
This tab shows a quick view of the details across walkaround checks and walkaround checks with defects.