In response to demand, the performance pages have been improved to make it easier to trace details of infringements that have contributed to a performance rating.
You can still add the number of weeks over which you would like your performance calculating, but now the average will only be updated at midnight every Sunday, so the average will remain static for a full fixed week.
Example
The company sets their performance average to be calculated over 12 weeks.
On Sunday June 18th the averages will be calculated going back 12 weeks from 18th June. Only weeks that contain activity will be included, so 12 weeks will always be the period in which the averages are calculated, but they will not necessarily be consecutive weeks if the driver has had holiday or been off sick.
Performance Graph
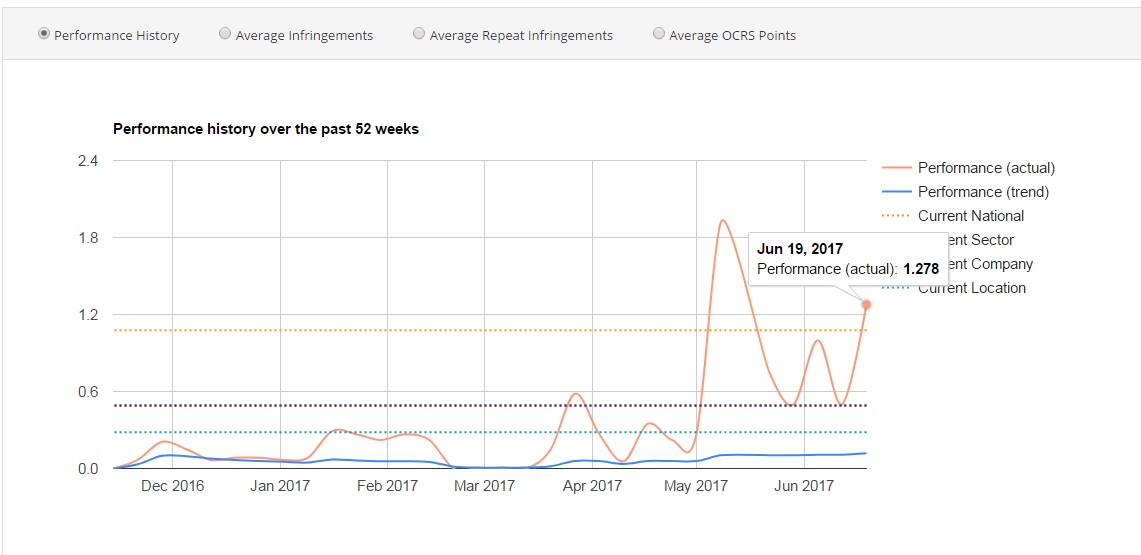
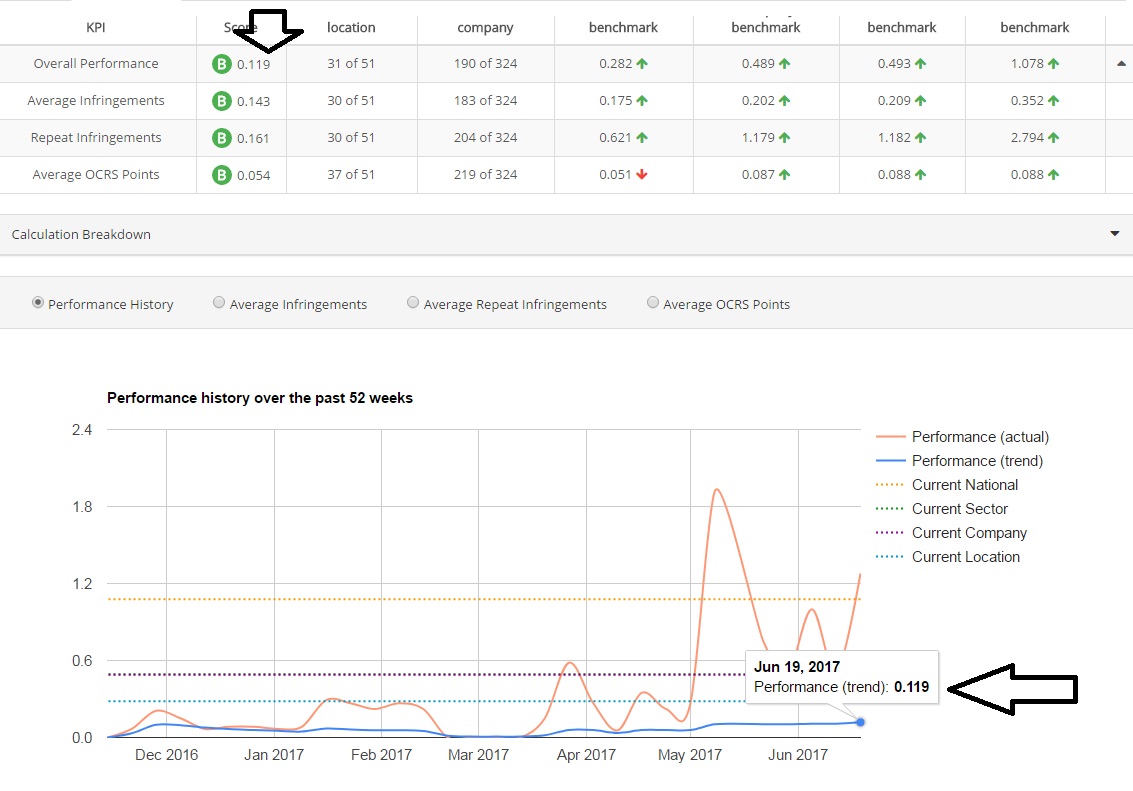
This now includes a “performance trend” and a “performance actual” line as well as continuing to show sector, company and national averages.
Performance Actual
The performance “actual” graph shows a calculation within a fixed week that contains activity. It is designed to show you how a driver is performing on a week by week basis as opposed to their averages over the period set in the performance admin screens. It should highlight where a driver has had a particularly poor week which may affect their cumulative performance score over the period set.
It calculates the relevant averages for each individual fixed week looking at the number of infringements divided by the number days in that fixed week with activity.
Repeat infringements looks back from the latest midnight Sunday over the performance period set, and adds up the number of repeat infringements. Rather than using the number of driver days in the period set to make the calculation, it uses the number of driver days in the fixed week to calculate the average.
Example
W/C Mon 19th June
Driver A has 3 days of activity
They include an EBR1 infringement and a WBR1 infringement
Average infringement total = 2 infringements/3 driver days = 0.67
OCRS = 100 points/3 driver days= 33.33/200 = 0.167
Repeat infringement
Code Occurrences Repeats Calculation Score
EBR1 4 3 3² 9
9/ 3 driver days = 3
Overall Performance =
0.667 +0.167+ 3/ 3 = 1.278

Performance trend
The performance trend graph shows the performance each week as at Sunday midnight for the period set in the performance admin screen. The graph is designed to show you the drivers progress over the last 52 weeks (where available) using their scores measured over the performance period set displaying what they were at Sunday midnight on each appropriate week.
The most recent figures shown on the graph will be the same as those shown in the performance table and calculation breakdown.

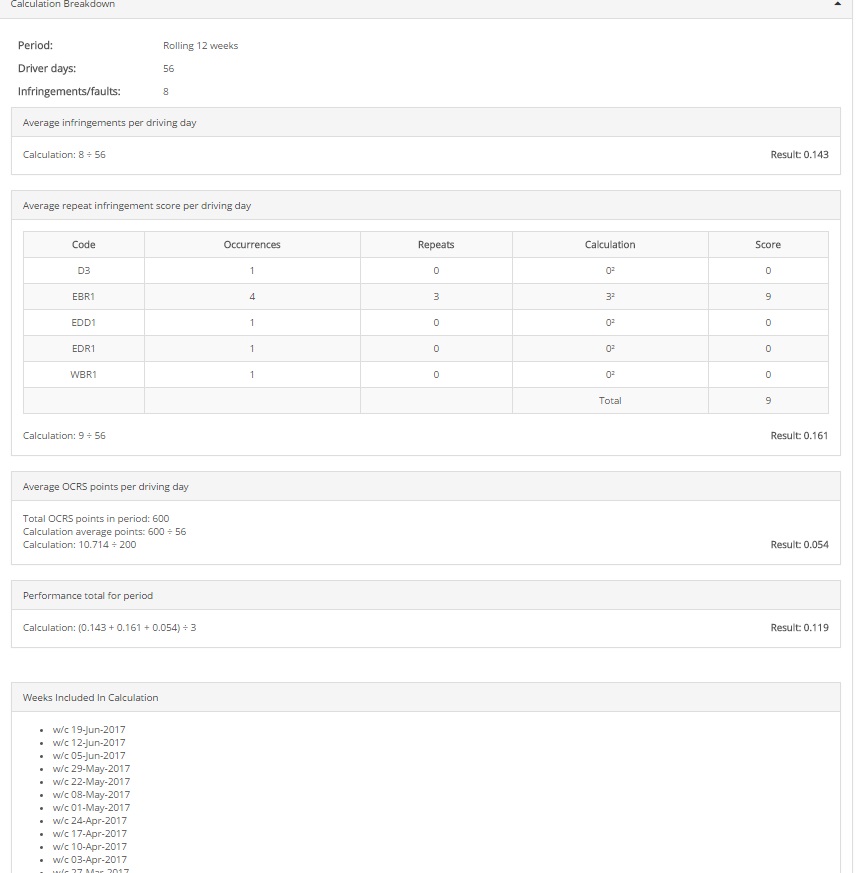
Calculation breakdown
The calculation breakdown is available as a drop down

It displays details of how the averages were calculated, as well as showing which weeks were included in that calculation

Print button
The calculation breakdown and graph can now be printed by clicking the button at the top of the page or using Ctrl P
If you think checking a driver's licence entitlements when he is first employed means you've ticked the box for due diligence, think again. Drivers have a duty to inform their employer of any changes that could affect their work but equally employers must take responsibility for their staff's competence on a day-to-day basis.
Have you put processes in place that will identify if a driver has received points on his licence while driving his own vehicle? Or if medication he is taking could impact on his ability to drive? Identifying driver impairments and checking fitness to drive are crucial to every transport operation and it's important to establish a robust checking process.
One way to check drivers on a regular basis is to add questions to their daily walk round check, either on paper or on an app. Questions such as 'have you had an alcoholic drink in the last 12 hours?' or 'have you started taking any medication that could affect your ability to drive?' offer an opportunity to remind employees of their obligations and open up discussions if you suspect they are not fit to drive.
The Van Excellence film 'One Fateful Day' highlights the potential impact of driver distraction for the driver, operations manager and company owner. A van driver who has taken drugs is involved in a fatal collision with a child and the film explores the devastating consequences.