













Vision Help Articles
Driver Dashboard Changes 2025
We have updated the following dashboards
- Infringement Overview
- Combined Dashboard
- Roaming Driver Combined Dashboard
In summary the dashboard will benefit from:
- Year on Year trends
- More intuitive navigation
- Improved export options
- Clearer indication of result trends
Infringement Overview
Changes have been made to the navigation of this dashboard with the buttons now being shown at the top of the page:
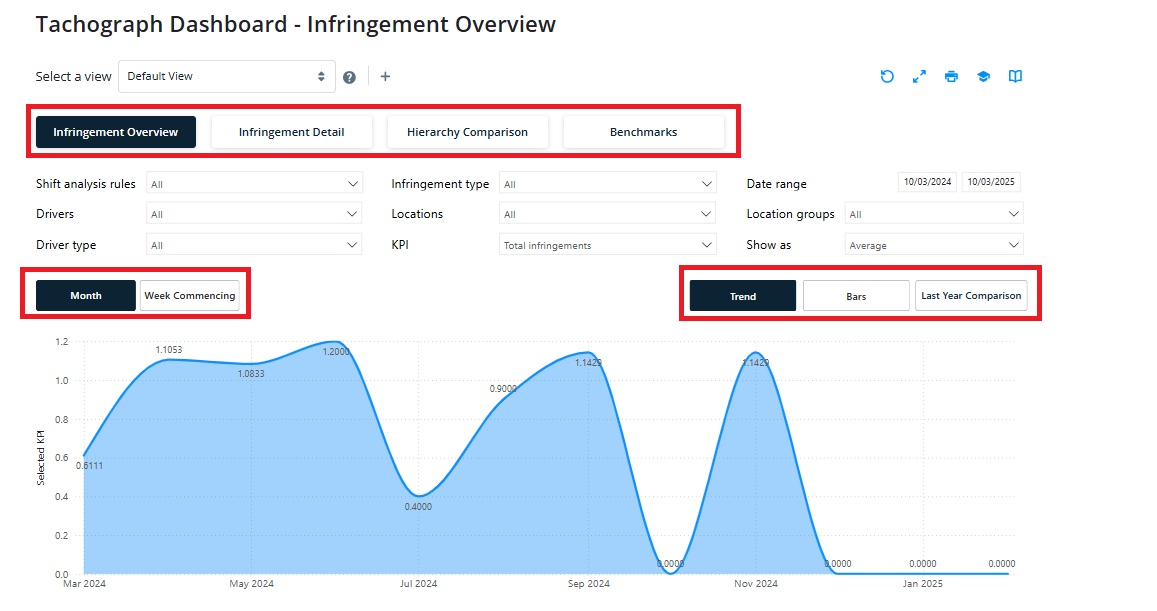
The initial overview page includes options to view by month or by weeks and allows you to view the trend graph as a bar chart or a trend graph.
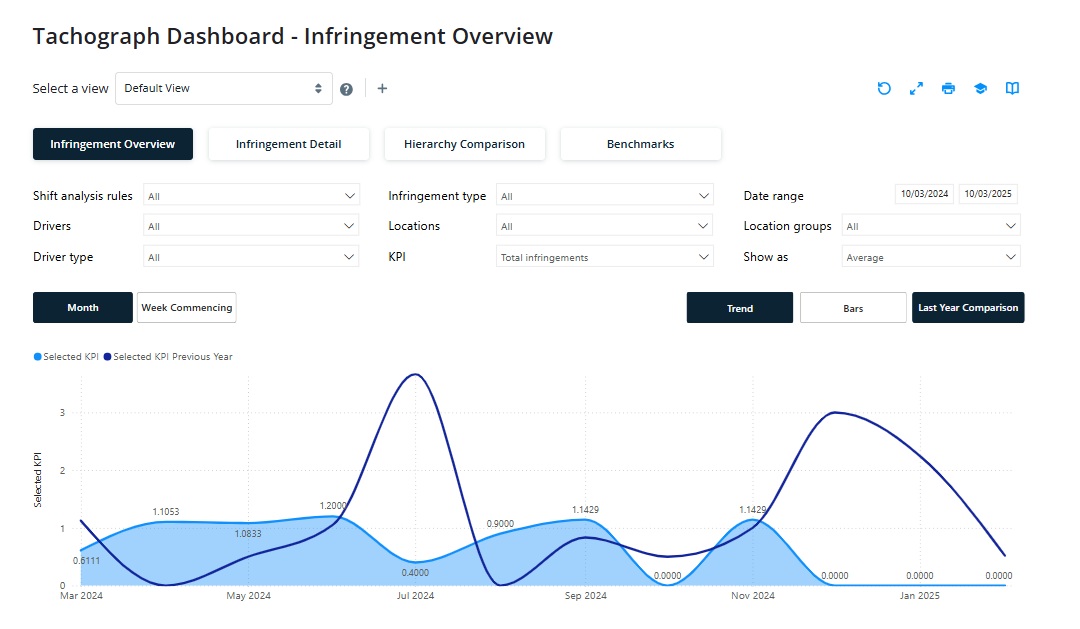
In addition, you can select the year-on-year trend to compare your company’s performance up to 30 months in the past.
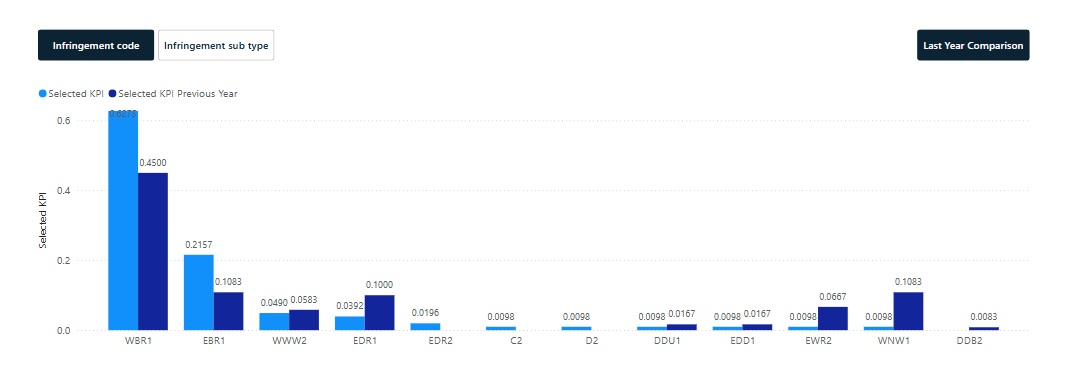
We have added a bar graph to show results for all infringements that can also be measured against previous years.
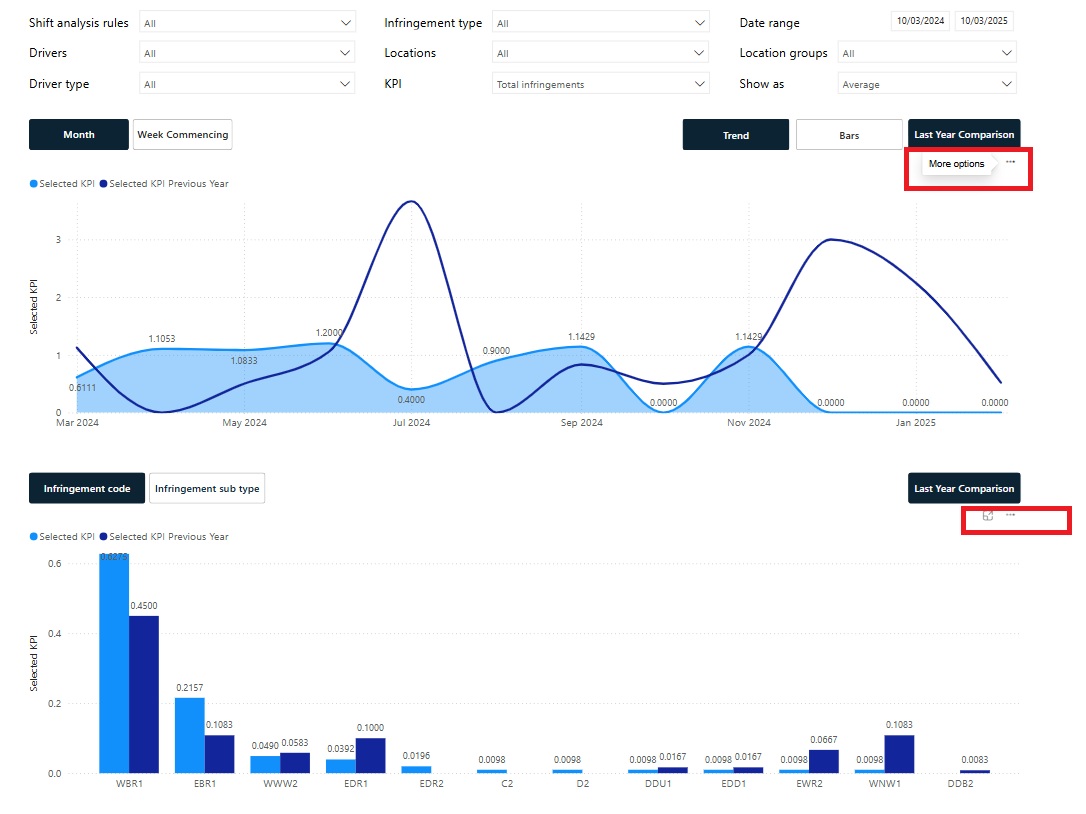
Both sections can be independently exported by clicking the 3 dots on each section:
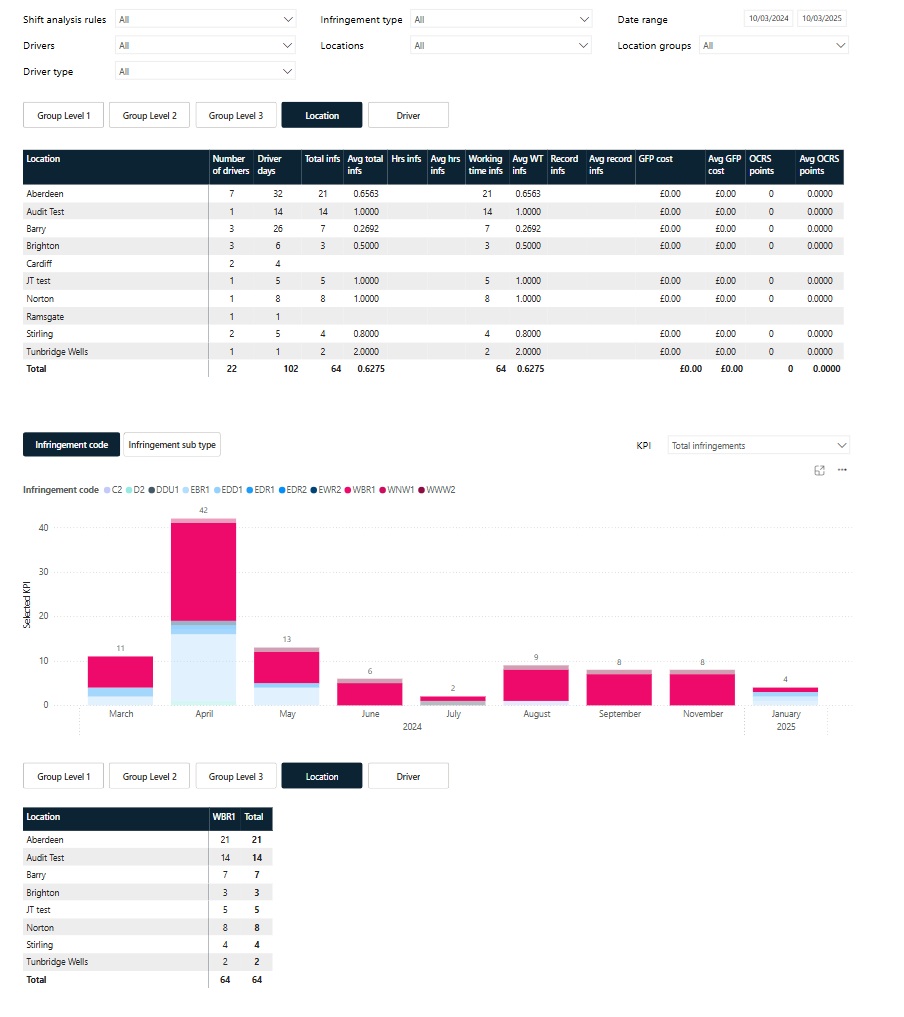
Infringement Detail
This shows specific details of types of infringements with the tables interacting with the bar selected and again, each section can be independently exported:
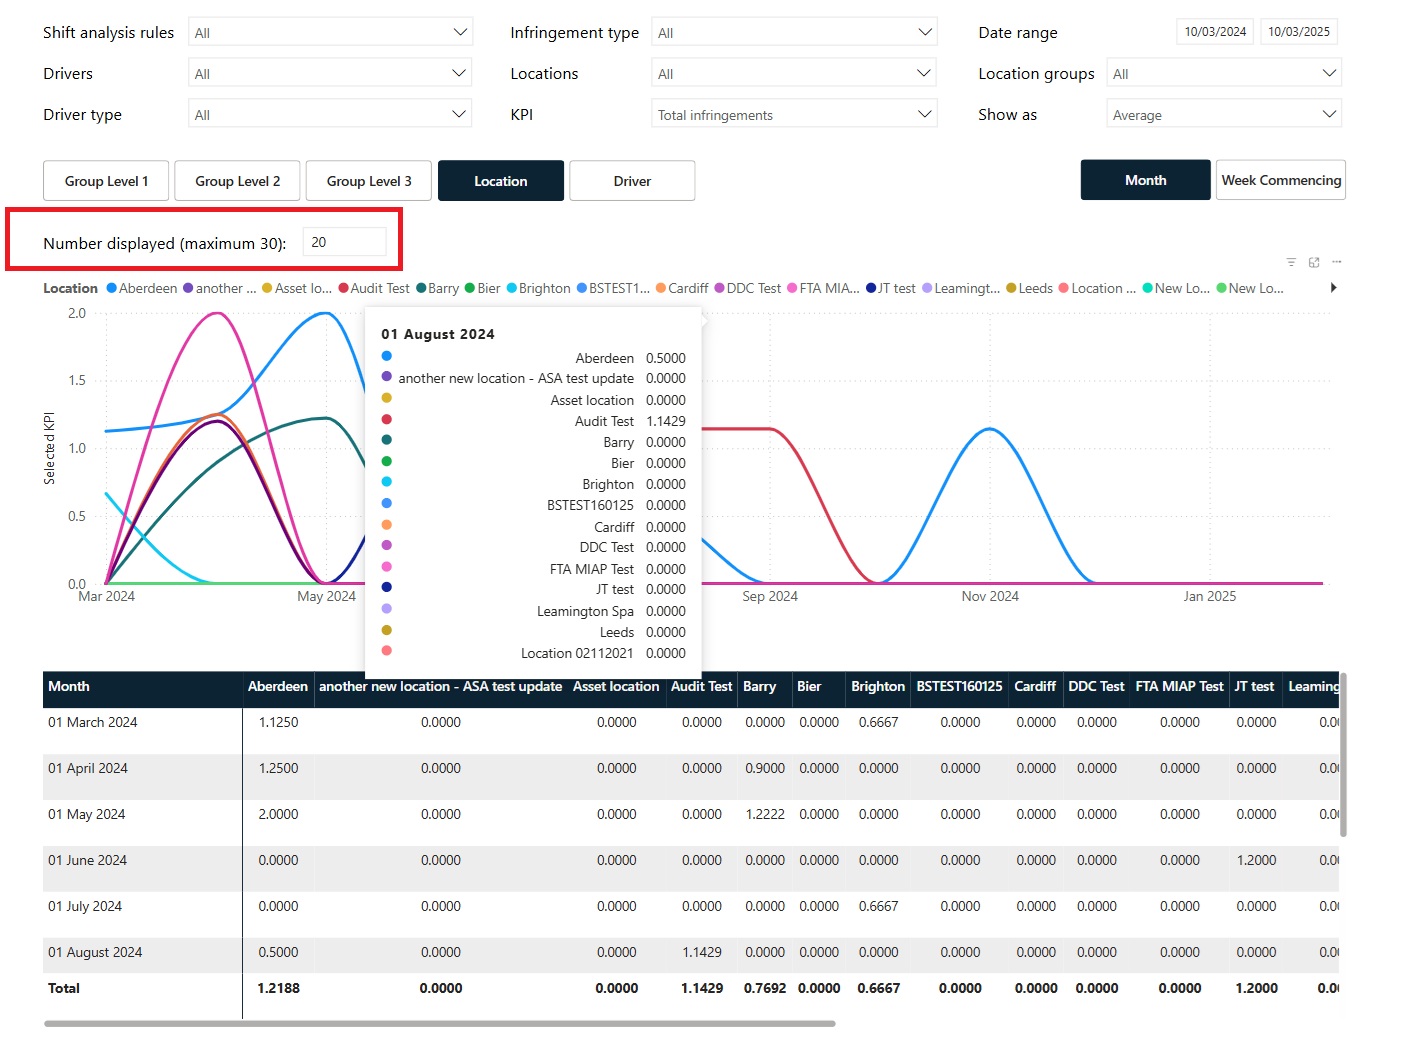
Hierarchy Comparison
We have updated the Hierarchy comparison to enable you to select more than 5 locations/drivers to compare in both the graph and the table and again, each section can be exported independently:
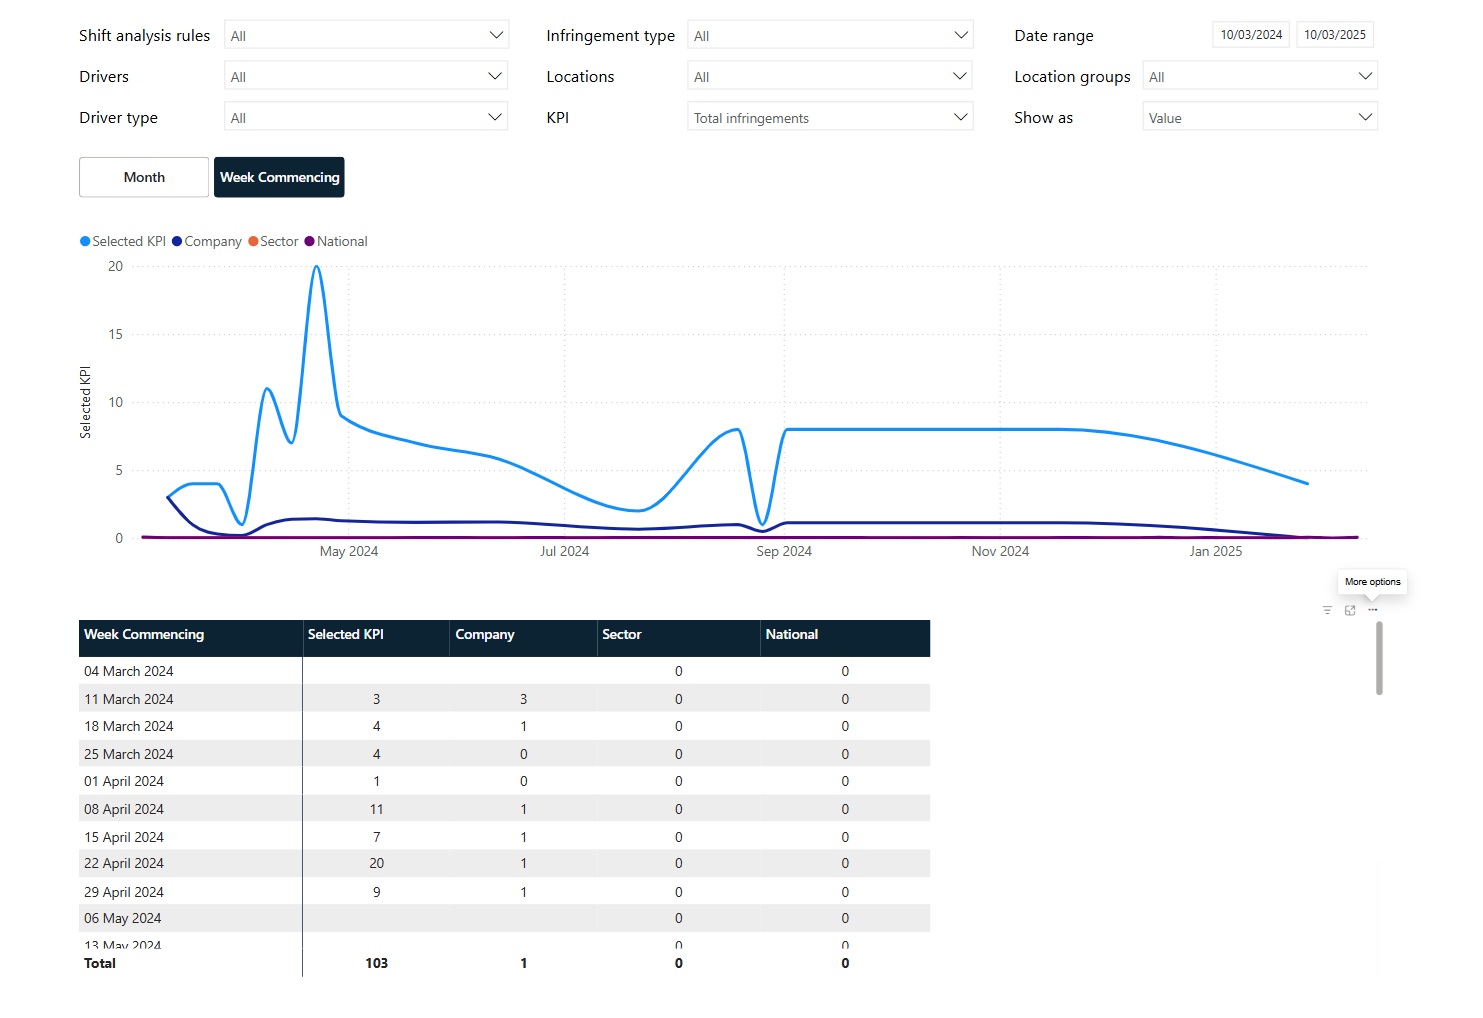
Benchmarks
This screen has been updated to show both the trend and the table on one page, again both can be exported independently:
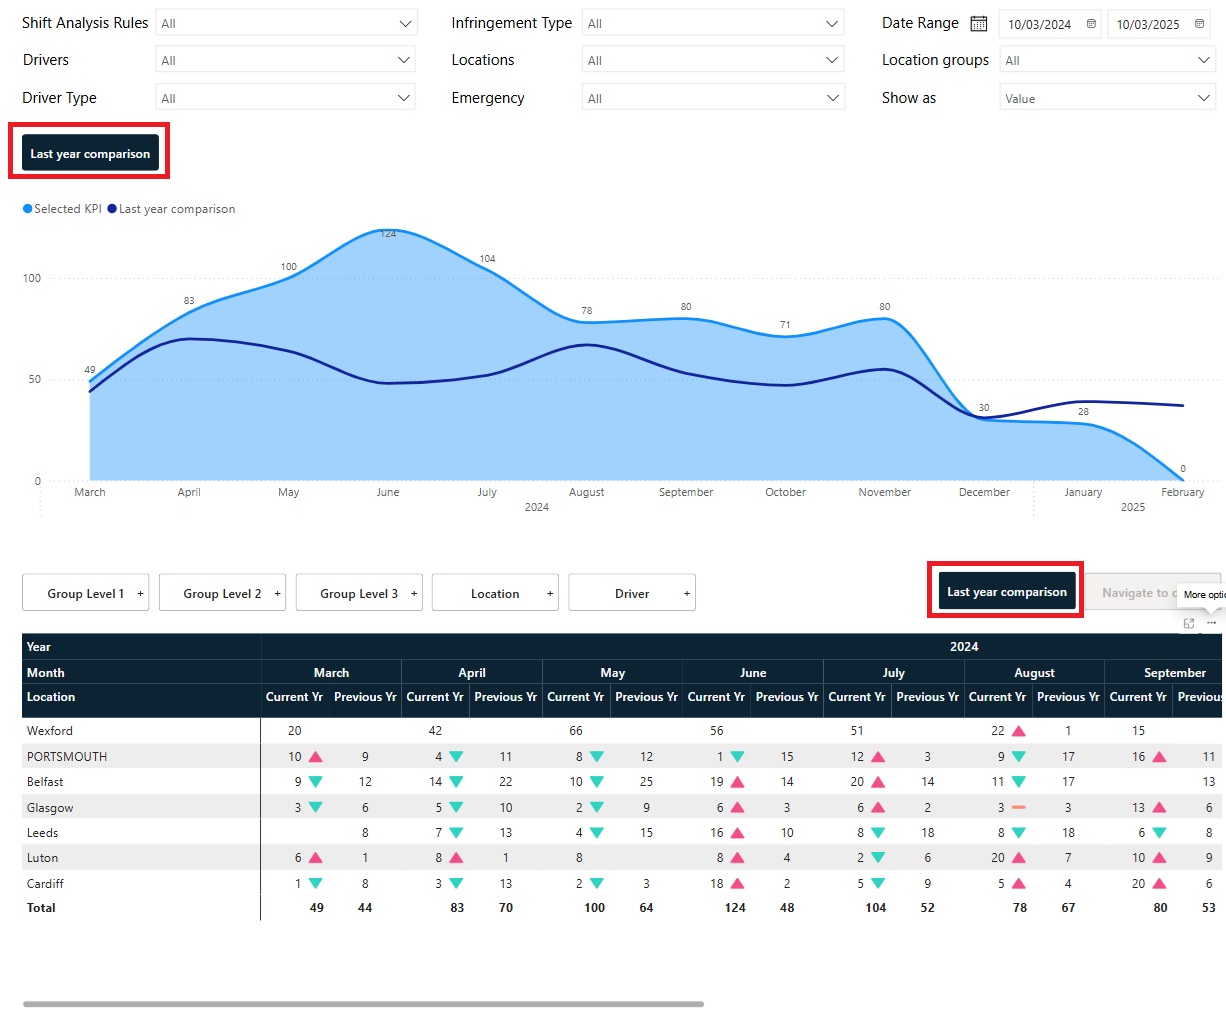
Combined Dashboard/ Roaming Dashboard
The Infringement Summary section has been updated to include the year-on-year trend on both the graph and in the table with indicators to highlight whether there is improvement or if results are worse than the previous year:
More Vision Help Articles Articles



Related Pages
Check out more news and media
Discover More

Become a Member
Our membership packages provide you with the tools to keep your operation safe, efficient and compliant.
Learn more

Press Releases
Latest updates, insights, and expert commentary shaping the future of logistics, transport, and supply chains across the UK.
Learn more

Services
Discover the full range of services from Logistics UK, designed to keep your operation safe, efficient, and compliant.
Services

Events
Discover upcoming Logistics UK events designed to bring industry leaders, policymakers, and businesses together.
Events
Stay Ahead. Stay Compliant. Stay Connected.
Join thousands of logistics professionals using Logistics UK to navigate industry change with confidence.
Join Us