Tachograph Dashboards
Tuesday 13 October 2020
We are delighted to introduce to you our new suite of Tachograph Dashboards. They can be accessed by contacting tachosupport@logistics.org.uk and asking for the driver dashboard permission to be enabled. Once you have that you will see a new option on your homepage called "New Tachograph Dashboards":
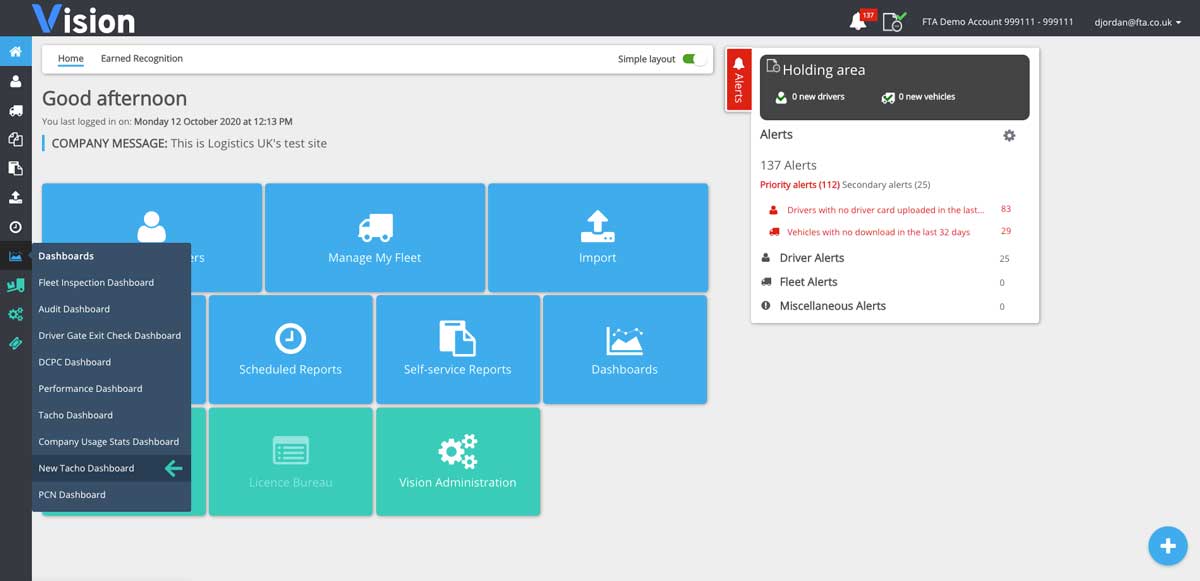
Click or tap this to reach our new landing page which will open up in a new tab. From there click or tap onto the “insights” link to access your new dashboards:
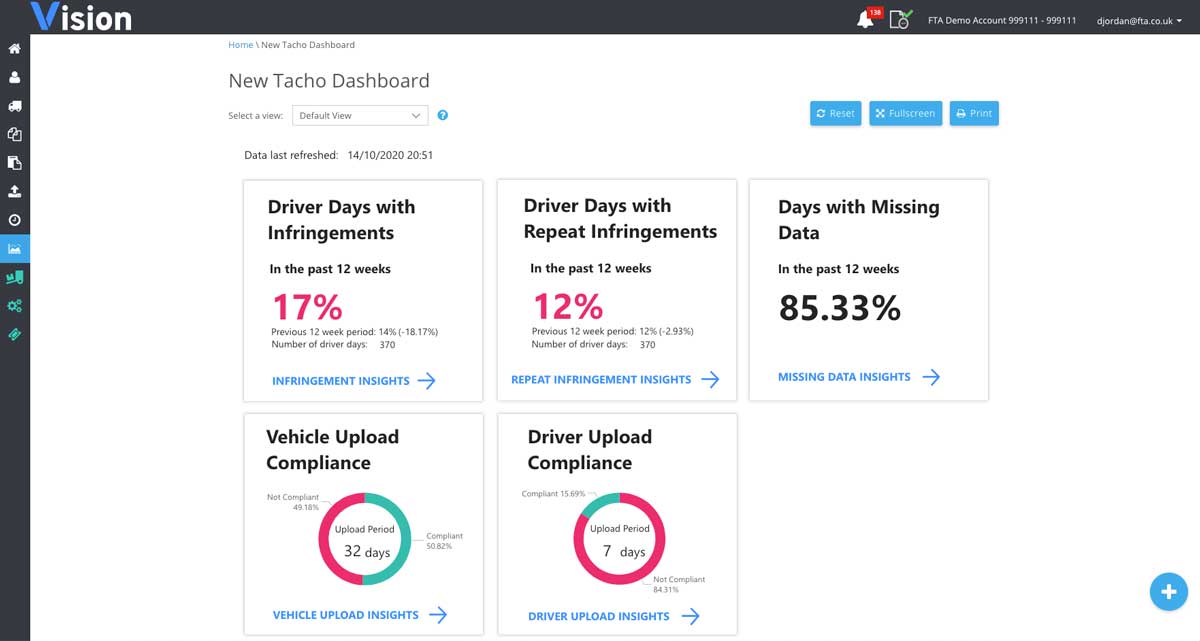
The Infringement Dashboard
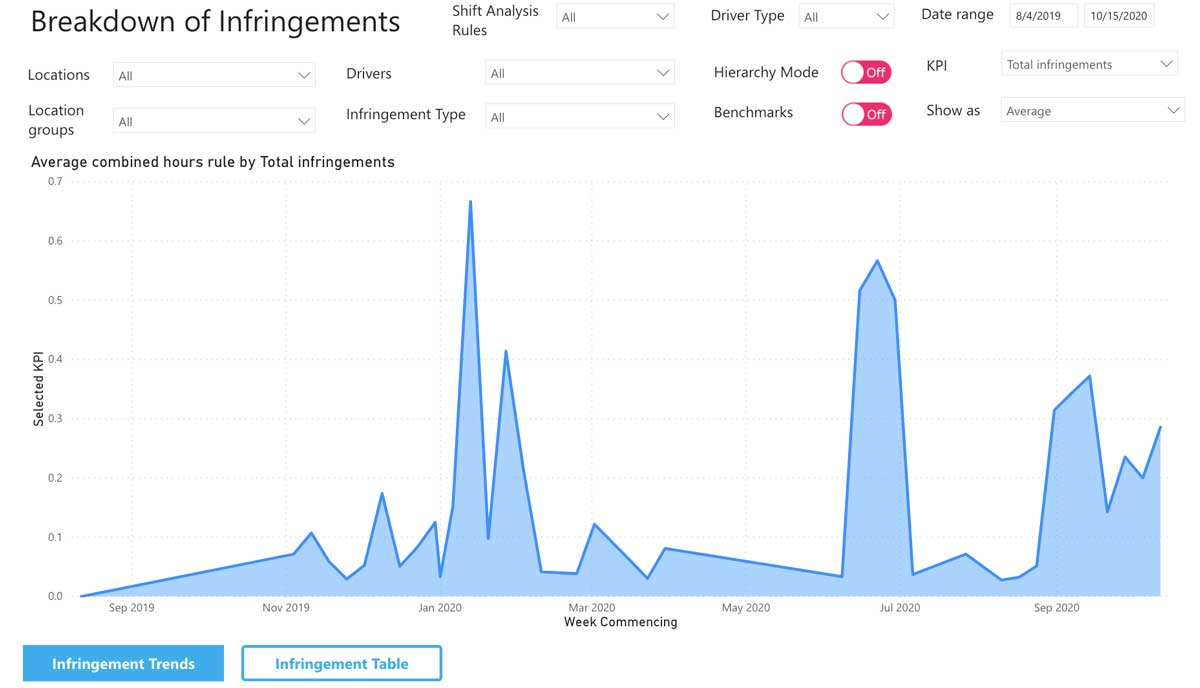
This is designed to compare and contrast different drivers’ hours, working time and record keeping infringements against various KPI’s including Total Infringements, GFP costs and OCRS points. Your information can be displayed against a date range of your choice and can be displayed according to your company hierarchy set up. Trends can be displayed against Company, Sector and National benchmarks:
The Repeat Infringement Dashboard
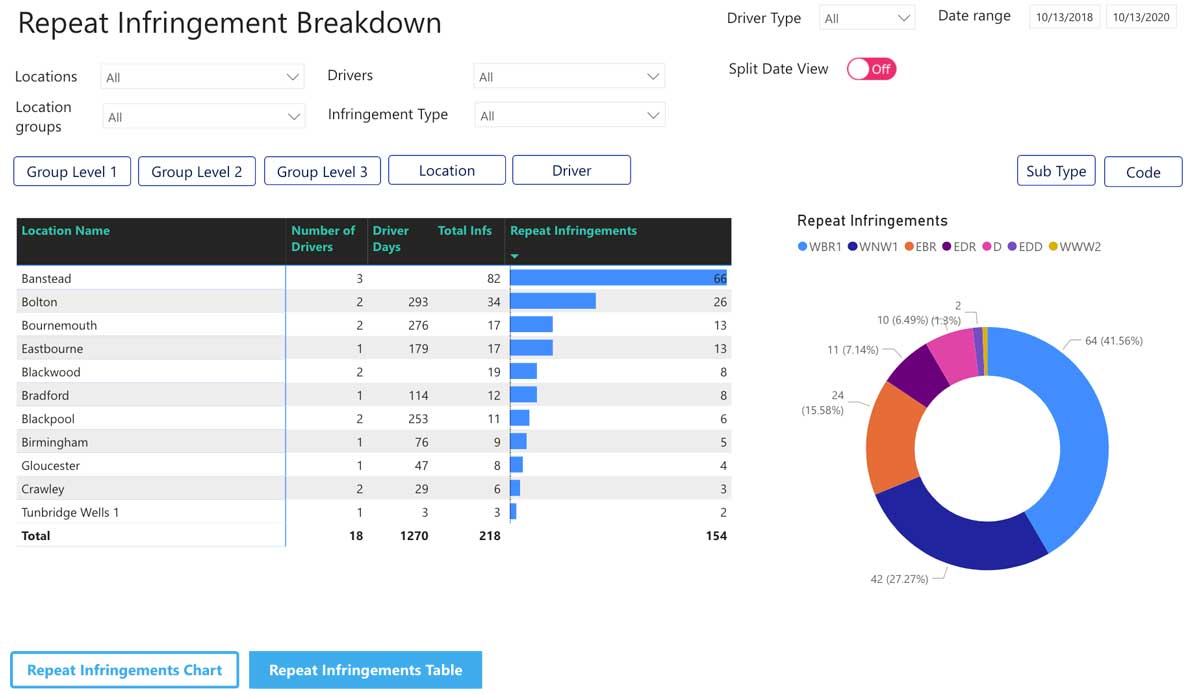
This displays information showing drivers who have repeat infringements, i.e. more than 1 of the same infringement in the date range you have selected. The information can be shown at all levels of your company hierarchy and with date ranges that you can specify. Results are displayed graphically as well as in a table format:
The Missing Data Dashboard
This shows those days where there are gaps where no data has been received, or where days have been marked as “awaiting data” for core drivers. The information can be displayed for a specific date range, and for all your company hierarchies. You can view the information as % of missing or received data or as a number for received, missing or awaiting days. Results are shown as a trend graph or in a table format:

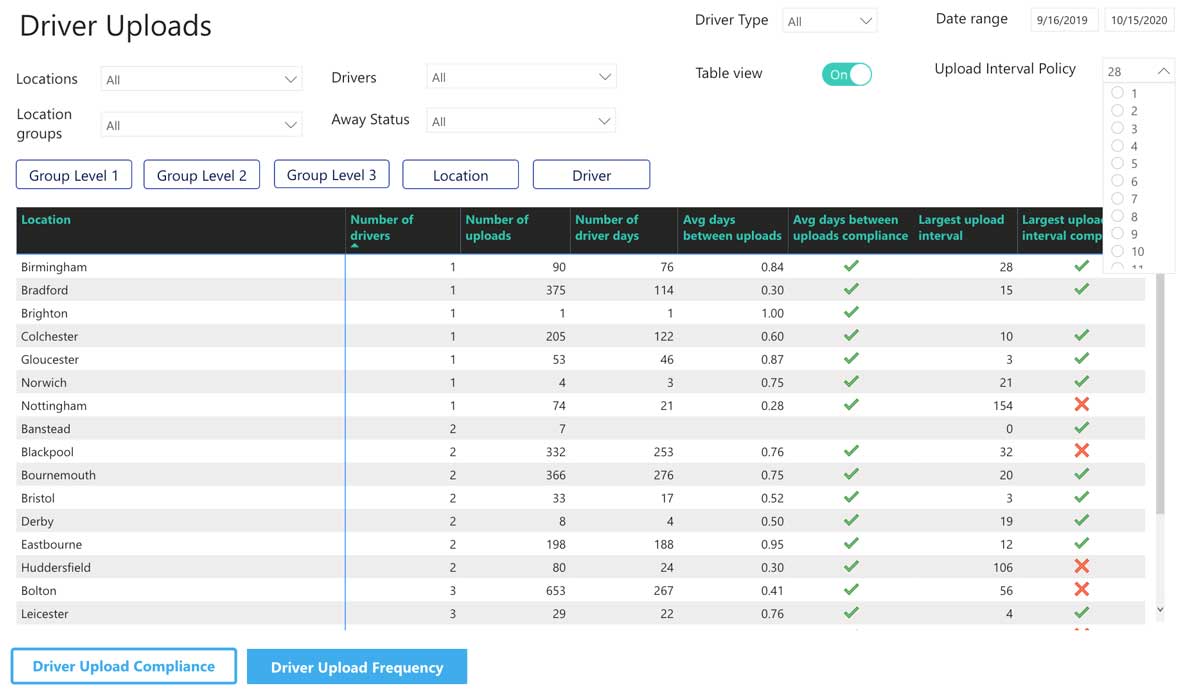
The Driver Upload Dashboard
This shows drivers compliance with your company upload settings, or where these aren’t set, against legal compliance of 28 days. The upload frequency table shows you results against an upload interval policy that you can select. Your drivers' compliance is indicated by a tick and non-compliance with a cross. Results can be shown at all levels of your company hierarchy if you have that set:
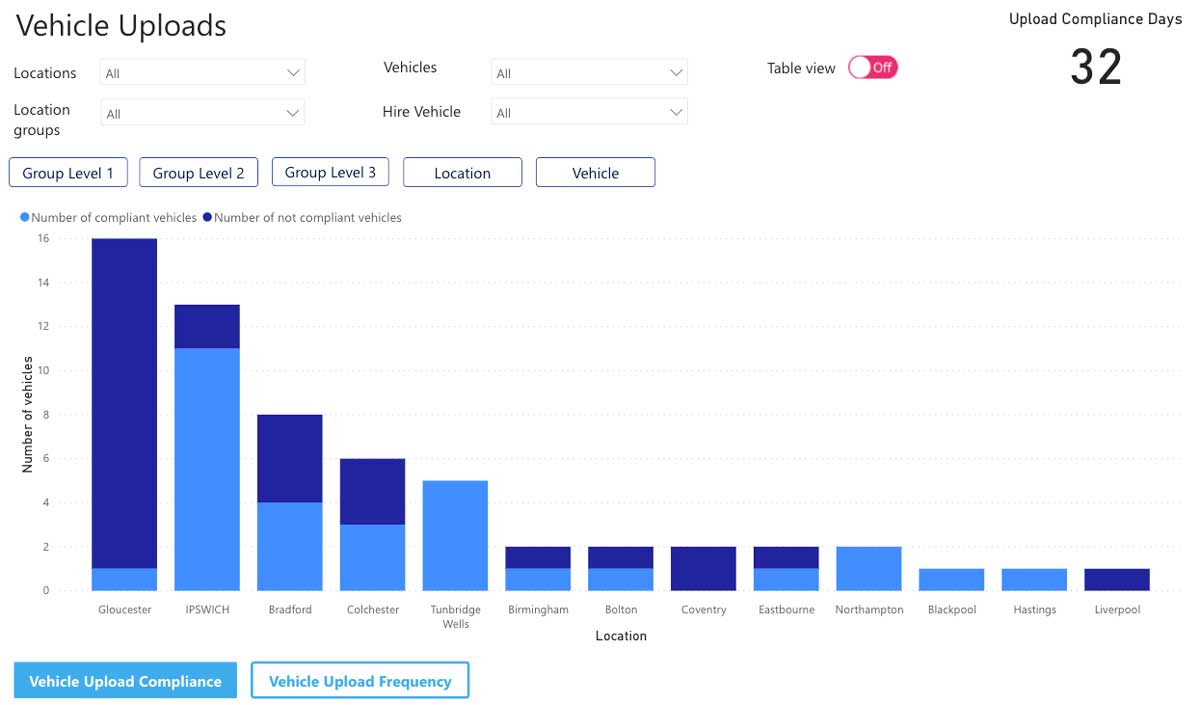
The Vehicle Upload Dashboard
This shows results for vehicle compliance against your company or legal upload settings. Results can also be displayed to show compliance with your company upload frequency policy which you can set within the report. Your vehicles compliance results can be shown at all levels of your company hierarchy if you have one set and can be shown in both graphical and table formats:
All our new Dashboards come with a short video tutorial to help you get started as quickly as possible. We hope you can make good use of these new features.